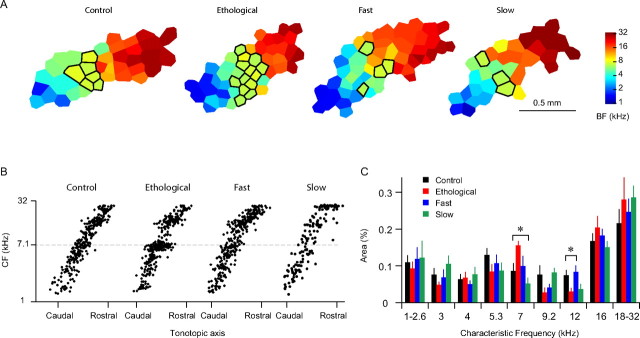
Figure 2.
Influences of stimulus presentation rate on spectral plasticity. A, Representative cortical CF maps of the control, ethological, fast, and slow groups. The areas representing 7 kHz ±0.2 octaves were outlined in black. B, Distributions of CFs along the tonotopic axis. C, Sizes of cortical areas representing different frequency bands. Significant differences were seen for the 7 kHz and 12 kHz bands. Error bars indicate SEM. *p < 0.05.

