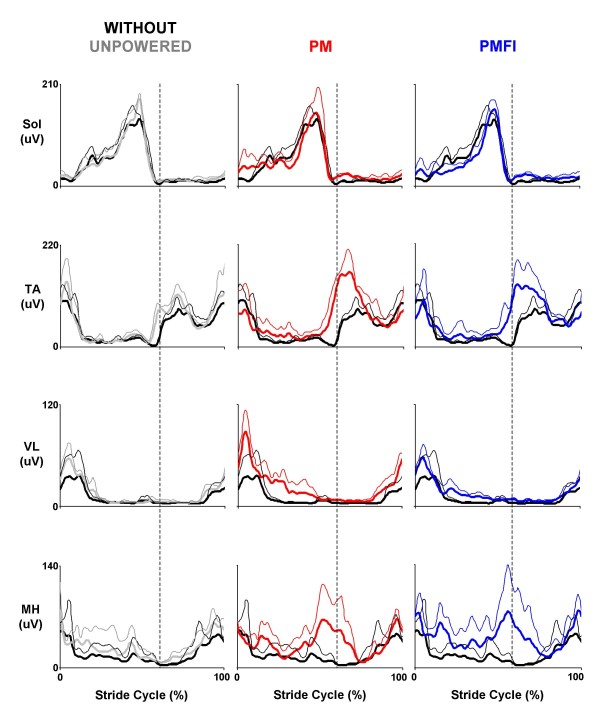
Figure 4.
Ankle and knee muscle surface electromyography. Three subject mean (thick lines) + 1 SD (thin lines) stride cycle average (0%-left heel strike to 100%-left heel strike) electromyography amplitudes (uV) for the knee-ankle-foot orthosis control muscles at the ankle (Sol – soleus and TA – tibialis anterior) and the knee (VL – vastus lateralis and MH – medial hamstrings). Data across rows (from left to right) are for walking at 1.25 m/s overground with the orthosis unpowered (Unpowered, gray), powered under proportional myoelectric control (PM, red) and powered under proportional myoelecric control with flexor inhibition (PMFI, blue). In each panel, traces are compared to normal walking without wearing the orthosis (Without, black). Dotted vertical lines mark the stance-swing transition at ~60% of the stride cycle.

