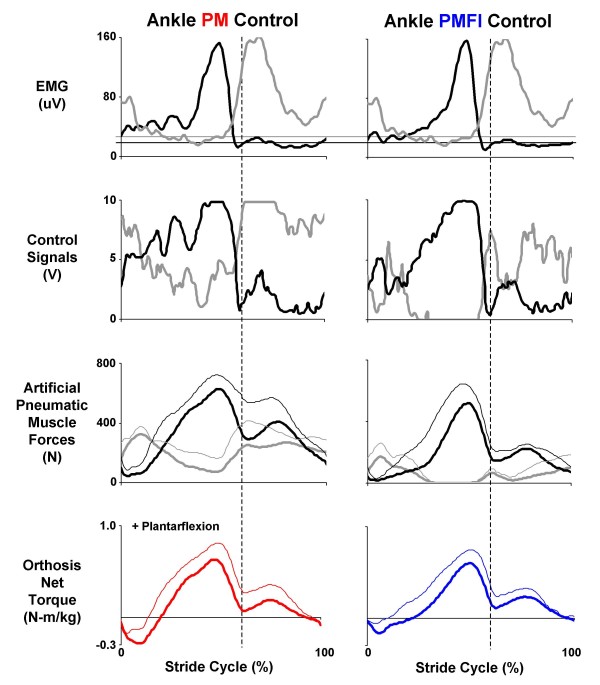
Figure 5.
Orthosis ankle joint control. Data are mean (solid lines) + 1 SD (thin lines where reported) for three subjects walking at 1.25 m/s with the knee-ankle-foot orthosis powered in two control modes: direct proportional myoelectric control (PM, left column) and proportional myoelectric control with flexor inhibition (PMFI, right column). Each column (from top to bottom) shows: surface electromyography (μV) from the users' soleus (black) and tibialis anterior (grey); processed pneumatic control signals (V) for the artificial plantarflexor (black) and dorsifelxor (grey); the forces (N) generated by the antagonistic artificial muscles (plantar flexor in black and dorsiflexor in grey); and the resulting net artificial muscle torque (N-m/kg) delivered at the ankle joint (PM, left column in red and PMFI, right column in blue). Plantar flexor torque is positive. All data are plotted over a stride cycle from left heel strike (0%) to left heel strike (100%). Dashed vertical lines at 60% of the stride mark the stance-swing transition. Horizontal lines on the electromyography traces indicate the threshold setting (μV) above which a proportional control signal is generated (plantar flexor in black and dorsiflexor in grey).

