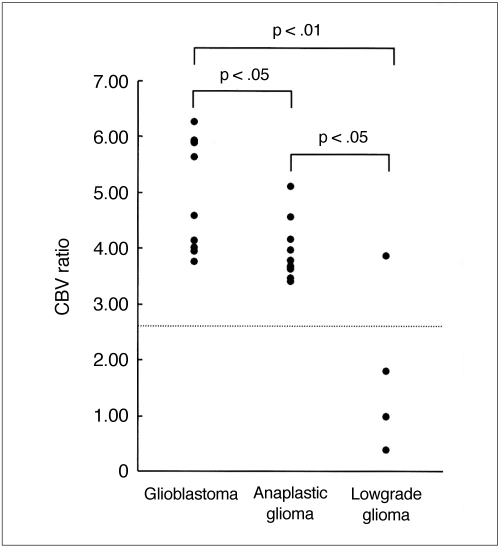
Fig. 4.
Plot of relative cerebral blood volume (rCBV) ratios in glioblastomas, anaplastic gliomas and low-grade gliomas. The rCBV ratio is highest in glioblastomas and lowest in low-grade gliomas. A comparison of mean rCBV ratios in each tumor group shows statistically significant differences between them. The dotted horizontal line represents the rCBV ratio cutoff value (2.60) which permitted discrimination between high-grade (glioblastomas and anaplastic gliomas) and low-grade gliomas.

