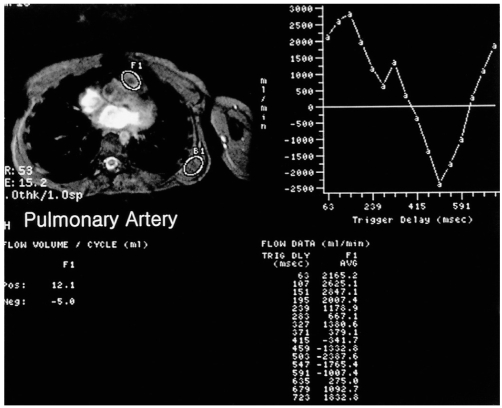
Fig. 15.
Estimation of the severity of pulmonary regurgitation after repair of tetralogy of Fallot using velocity-encoded cine MRI. The curve on the right plots pulmonary arterial flow against ECG-trigger delay time. The area between the baseline and the curve below the baseline represents regurgitant volume.

