
Figure 3.
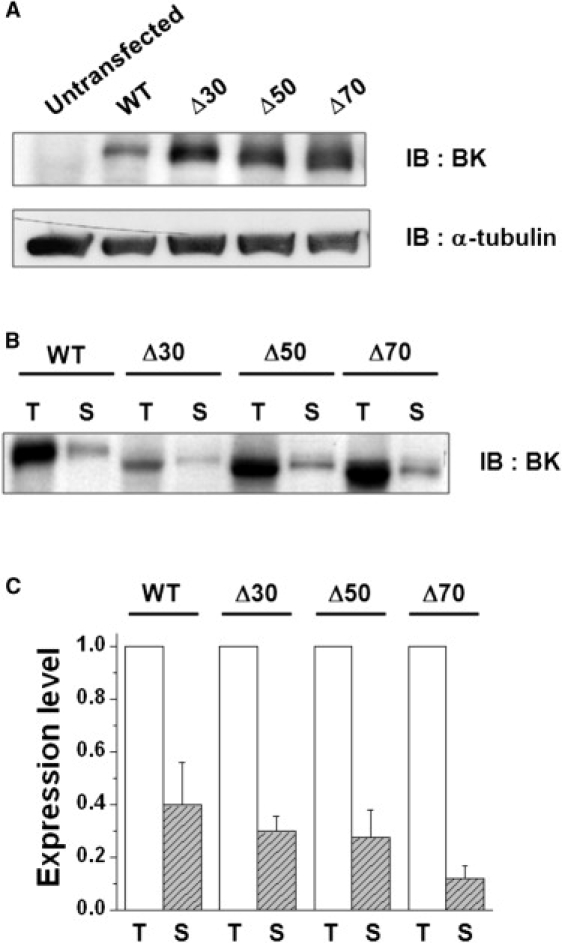
Cell-surface expression of WT and three different mutant channels. (A) Immunoblot analysis of the WT and NORS deletion mutants. The WT and three different mutant channels (Δ30, Δ50, and Δ70) were transiently transfected in CHO-K1 cells and the cell lysates were subjected to immunoblot (IB) analysis using anti-BKCa channel antibody (α-BK) and antitubulin antibody (α-tubulin), respectively. (B) Cell-surface biotinylation of WT and NORS deletion mutants. Cells transfected with the WT and deletion mutants were biotinylated and subsequently precipitated using Neutravidin-agarose. The precipitates were subjected to immunoblot analysis. Total protein (T) and surface-expressed BKCa channel (S) are shown. (C) Densitometric quantitation of T and S. Immunoreactive band intensities of the WT and mutant channels were quantified with a densitometer. The band intensity of the channel expressed on the cell surface (S, hatched bars) was normalized by that of the total channel (T, open bars). Data represent the mean ± SE (n = 4). No significant changes in surface expression were detected among mutant channels (paired t-test).