
Figure 4.
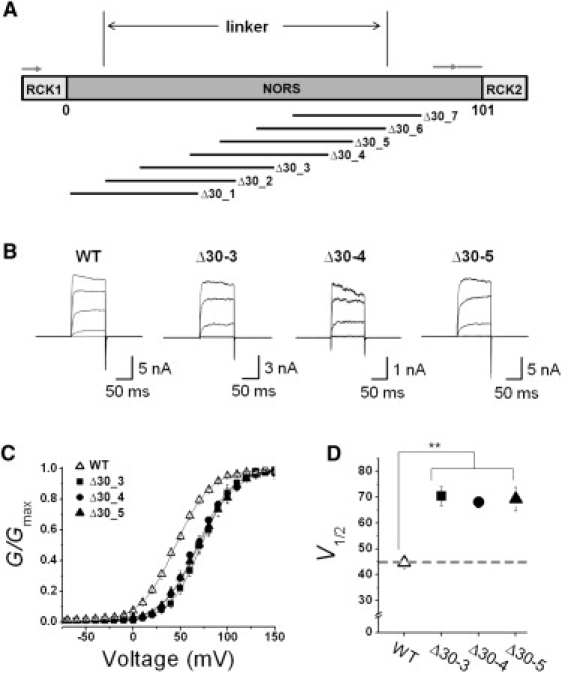
Functional effects of 30-amino acid deletions at different positions. (A) Relative position of 30-amino acid deletion generated in the loop region connecting RCK1 and RCK2. The position of each deletion is shown in Fig. S2. (B) Representative macroscopic current traces of the WT and mutant BKCa channels. The functional activity of each construct was tested using excised inside-out patch clamp recordings. Ionic currents were induced by voltage steps ranging from −10 mV to 150 mV at 40 mV increments from the holding voltage of −100 mV. Due to the marked differences in channel expression level, the scale bar for each mutant channel was adjusted accordingly. (C) Normalized conductance-voltage relationships (G/Gmax versus Vm) of the WT (open symbols) and several mutant channels (solid symbols). The membrane was held at −100 mV and then stepped from −80 mV to 150 mV in 10-mV increments for 100 ms. The symbols for each mutant channel are indicated in the inset. Each channel was recorded in the presence of 2 μM [Ca2+]i. Data points were fitted with the Boltzmann function. (D) Membrane potential of half-maximal activation (V1/2) determined at 2 μM [Ca2+]i. Each data point represents the mean ± SE. Values that differ from the WT by a paired Student's t-test at p < 0.05 (∗) or p < 0.01 (∗∗) are indicated.