
Figure 8.
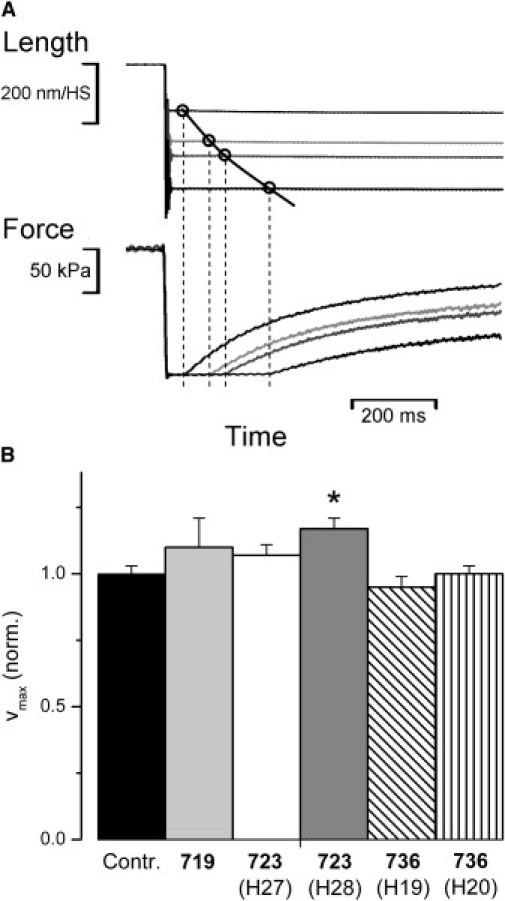
Maximum unloaded shortening velocity (vmax) of control fibers and fibers with mutation. (A) Sample data traces of slack test experiments (39,40)) to determine vmax of a control fiber at 20°C. The time required by the fiber to shorten until the imposed slack is taken up, i.e., until force starts to redevelop, is plotted versus the amplitude of the length change, as indicated by the four data points. Usually at least 10 slacks of different amplitudes were applied to a fiber to obtain the shortening curve. Every slack was followed by a release/restretch maneuver (cf. Fig. 6) to avoid restretching the fibers to isometric length after partial redevelopment of force. vmax, i.e., the initial slope of the shortening curve, is determined by curve fitting. Length of fiber shown here, 3000 μm; sarcomere length 2.4 μm; CSA, 8500 μm2; amplitude of slacks from top to bottom 14%, 22%, 26%, and 36% of fiber length, respectively. Time of slack until start of force increase from left to right 45 ms, 104 ms, 136 ms, and 247 ms, respectively. vmax of this fiber was 3450 (nm/HS)s−1. (B) Effects of mutations R719W, R723G, and I736T on vmax; n = 6–11 fibers. T = 20°. Note effects of mutations on vmax essentially identical for both, 10°C and 20°C (data for 10°C not shown). Mean values (±SE) normalized to values of control fibers. For absolute values see Table 1. Asterisk indicates statistically significant difference to controls. A statistically significant change in vmax compared to controls (p ≤ 0.05) was only found for fibers of patient H28 (mutation R723G).