
Figure 5.
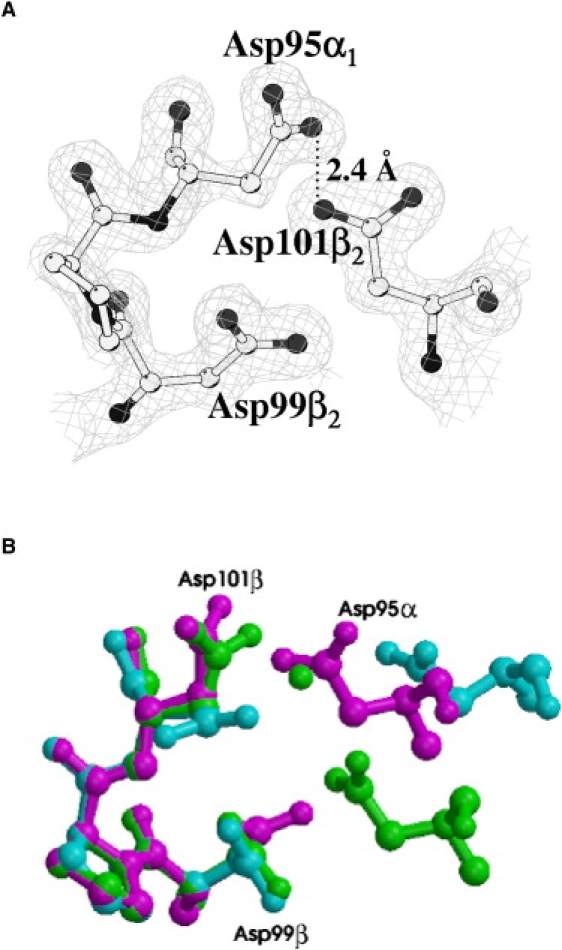
(A) Omit Fo-Fc electron density map contoured at 3.0 σ at the α1β2 interface of pH6-HbTb. (B) Superimposed α1β2 interfaces of HbTb observed in the T (purple), R (cyan), and H (green) quaternary structures.
Official websites use .gov
A
.gov website belongs to an official
government organization in the United States.
Secure .gov websites use HTTPS
A lock (
) or https:// means you've safely
connected to the .gov website. Share sensitive
information only on official, secure websites.
(A) Omit Fo-Fc electron density map contoured at 3.0 σ at the α1β2 interface of pH6-HbTb. (B) Superimposed α1β2 interfaces of HbTb observed in the T (purple), R (cyan), and H (green) quaternary structures.