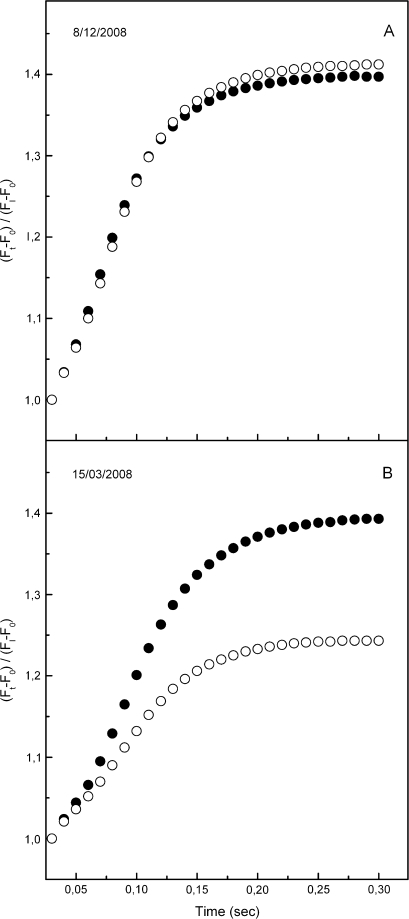
Fig. 5.
Fluorescence rise kinetics of the I–P phase in green (closed circles) and red (open circles) phenotypes before (08/12/2007) and after (15/03/2008) leaf reddening of the red phenotype. On the vertical axis fluorescence is given as (Ft–F0)/(FI–F0), after normalization at FI. F0 and FI stand for fluorescence yield at 20 μs and at 30 ms, respectively. Values are means from five plants (six leaves per plant).

