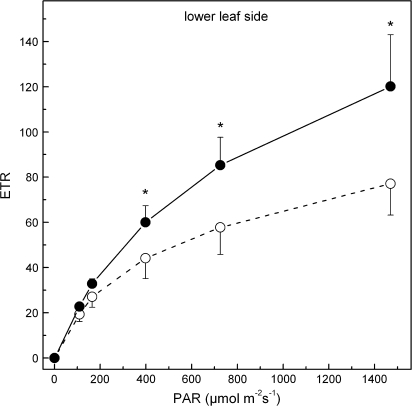
Fig. 7.
Linear electron transport rates (ETR) along PSII in the lower leaf side of green (closed circles) and red (open circles) phenotypes. The experiment was performed during the ‘red’ period (5 March 2008). The leaves remained under the indicated PAR until stable values for each parameter were obtained. Values are means ±standard deviation from five plants (four leaves per plant). The asterisks denote statistically significant (P <0.05) differences between the two phenotypes in the parameter indicated for each PAR level.

