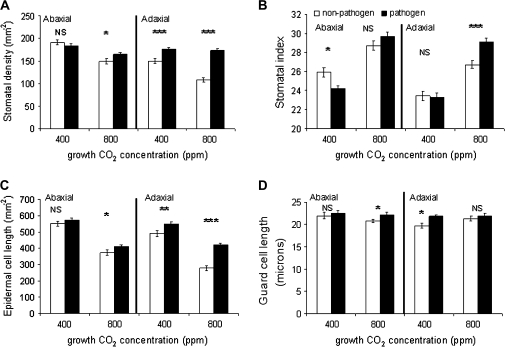
Fig. 2.
Stomatal characteristics. (A) Stomatal density, (B) stomatal index, (C) epidermal cell density, and (D) guard cell length of newly developed leaves following pathogen challenge of mature leaves under ambient (Amb–400 ppm) and elevated (Elev–800 ppm) CO2 concentrations, with non-pathogen challenged controls. Both abaxial and adaxial leaf surfaces are shown. ***P <0.0001, **P <0.001, *P <0.05, NS, not significant between pathogen and non-pathogen challenge. Two-way ANOVA, Table 1, n=70, bar=SEmean.

