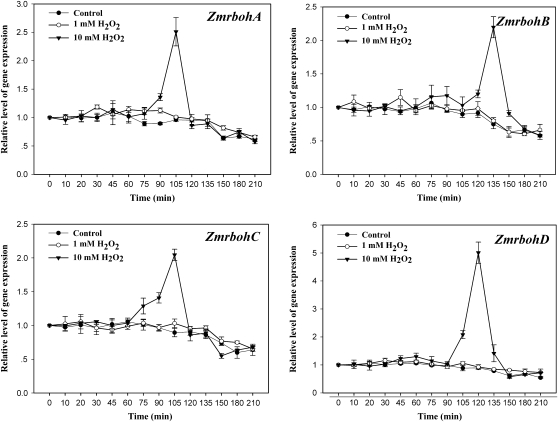
Fig. 4.
Expression analysis of ZmrbohA–D in leaves of maize plants exposed to H2O2 treatment. The detached plants were treated with H2O2 (1 mM and 10 mM) for various times as indicated. The plants treated with distilled water under the same conditions during the whole period served as controls. Relative expression levels of Zmrboh genes, analysed by real-time quantitative PCR, are presented as values relative to those of the controls at 0 min, defined as 1, after normalization to Zmactin transcript levels. Values are means ±standard error (n=3).

