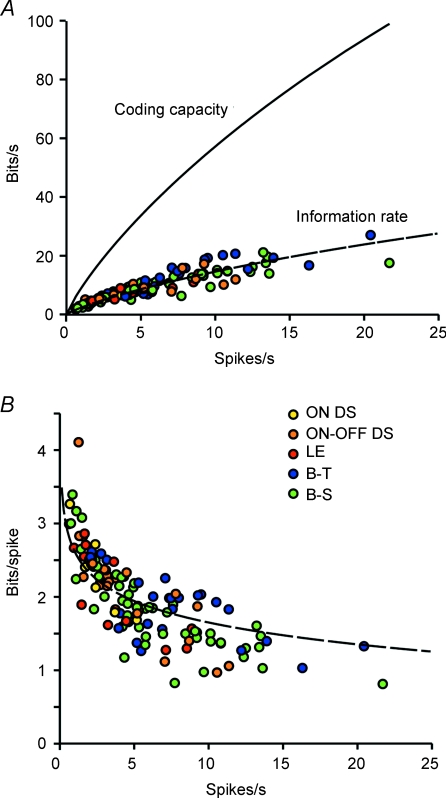
Figure 6. All cell types transmit information with similar efficiency.
Information rate (total entropy – noise entropy) was estimated by the direct method (Koch et al. 2006). A, continuous line shows the coding capacity (C(R)) of a ganglion cell at a given firing rate. This is the information rate assuming a Poisson process with each interval independent). Coloured dots show information rates for each recorded cell, and for all types of stimuli. Dashed line shows the best fit to information rate as a fraction of coding capacity: I(R) = 0.26 C(R). Information rate for all cell types and stimuli was thus ∼26% of coding capacity. B, dashed line indicates the information per spike 0.26 * C(R)/R. Lower rates carry more bits per spike. B-T, brisk-transient; B-S, brisk-sustained.; LE, local-edge. (Adapted from Koch et al. 2006.)

