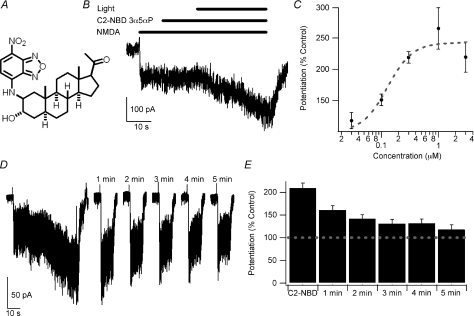
Figure 1. Blue-light potentiation of NMDA responses.
A, structure of C2-NBD 3α5αP. B, example of blue-light potentiation of the response to 10 μm NMDA with 300 nm C2-NBD 3α5αP. C, concentration–response curve of 0.03 μm (n= 5), 0.1 μm (n= 5), 0.3 μm (n= 58), 1 μm (n= 5) and 3 μm (n= 5) C2-NBD 3α5αP potentiation of 10 μm NMDA-induced currents. The dashed line represents a fit of the Hill equation with EC50= 0.13 μm and n= 2.0. Note that the fit was performed with the baseline fixed at 100% and that the fit is empirical only and does not necessarily imply that a typical drug–receptor interaction mediates the light-induced potentiation. D, the left portion of the panel illustrates blue-light potentiation using the same protocol depicted in panel B. The cell was then re-challenged with a 10 s application of 10 μm NMDA once every minute for 5 min. E, summary bar graph of potentiation immediately after light exposure and for every re-challenge (n= 8). Error bars represent s.e.m. Baseline response is 100% (dashed line). Note the slow decay of the potentiation. Responses following light exposure and at 1 and 2 min were significantly different from current immediately prior to activation of the light (repeated-measures ANOVA followed by Dunnett's test, P < 0.05). Recordings were performed with CsMeSO4 internal solution at −60 mV in cultured hippocampal neurons.

