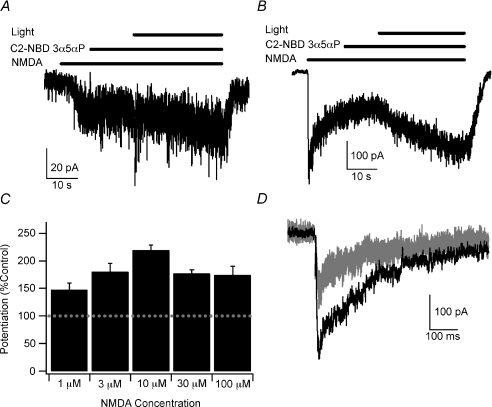
Figure 2. Blue-light potentiation of responses to 1–100 μm NMDA and synaptic NMDA responses.
A, example of blue-light potentiation of the response to 1 μm NMDA with 300 nm C2-NBD 3α5αP. B, example of blue-light potentiation of the response to 100 μm NMDA with 300 nm C2-NBD 3α5αP. C, summary bar graph of average potentiation with 1 μm, 3 μm, 10 μm, 30 μm and 100 μm NMDA in the presence of 300 nm C2-NBD 3α5αP. Error bars represent s.e.m. Baseline response is 100% (dashed line). Potentiated currents at each NMDA concentration were significantly different from the current prior to activation of the light (paired t test, P < 0.05; n= 5, 5, 58, 4 and 5, respectively). There was no statistically significant difference between NMDA concentrations (one-way ANOVA, P > 0.05). Recordings were performed with CsMeSO4 internal solution at −60 mV in cultured hippocampal neurons. D, example of blue-light potentiation of autaptic NMDA responses. Three baseline responses (superimposed grey traces) were recorded prior to a 30 s exposure to C2-NBD 3α5αP and blue light. Another autaptic response (black trace) was recorded immediately after washing out C2-NBD 3α5αP. Peak responses were potentiated to 178.9 ± 22.4% of baseline (P < 0.05, paired t test, n= 9). Stimulus artifact was blanked for clarity. Recordings were made in cultured hippocampal neurons at a holding potential of −60 mV with 2 mm CaCl2 in the external solution and with potassium gluconate replacing CsMeSO4 in the internal solution.

