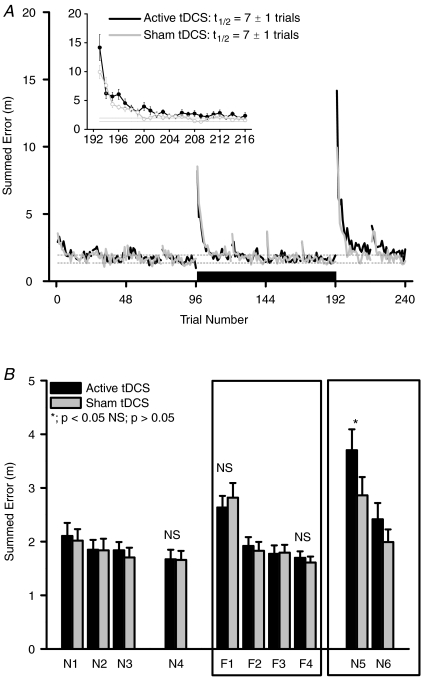
Figure 3.
A, effect of anodal tDCS on summed trajectory error during motor adaptation. Main panel: trial-by-trial error during pre-adaptation (trials 1–96; Blocks N1–N4), motor adaptation (trials 97–192; Blocks F1–F4) and after adaptation (trials 193–240; Blocks N5–N6) periods. Black bar represents period of tDCS application. Black line is continual active tDCS condition (1 mA; 17 min) and grey line is sham tDCS condition (1 mA; 30 s). Dotted lines are s.e.m. values of average data from pre-adaptation null field trials in the sham tDCS condition (trials 73–96; Block N4). Trial values are means only (s.e.m. not included for clarity; n= 14 for each tDCS condition). Inset: mean ±s.e.m. trial-by-trial data (n= 14) during early de-adaptation period (trials 193–216; Block N5) after combined tDCS and motor adaptation. Half-lives (t1/2; trials) were calculated using an exponential decay curve fit. B, differences in summed trajectory error before, during and after motor adaptation between active vs. sham tDCS. Summed error (values are mean ±s.e.m.; n= 14) was averaged from 24 trials in each block. Blocks N1–N4, pre-adaptation null force field. Blocks F1–F4, during motor adaptation to the velocity-dependent force field. Blocks N5–N6, null force fields after motor adaptation. Black columns are active tDCS and grey columns are sham tDCS conditions. NS, no significant difference between active and sham tDCS in that block. *Significant difference between active and sham tDCS conditions in that block (paired t test; P < 0.05). Main statistical analysis is restricted to Blocks N4, F1, F4 and N5 (see text for full results).

