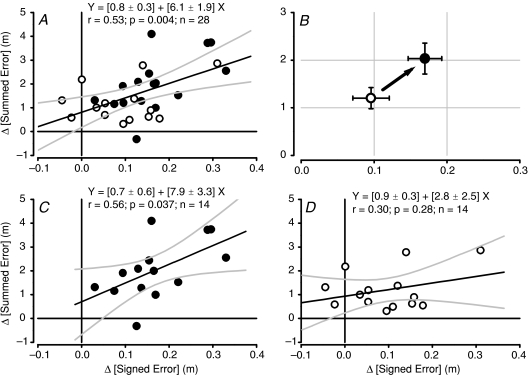
Figure 6. Correlation between development of signed error during motor adaptation with anodal tDCS and summed trajectory error after motor adaptation.
A, correlation between signed and summed errors from both tDCS conditions using all data in regression analysis (n= 28 total; filled circles, active tDCS; open circles, sham tDCS). Thick dark line is mean with ± 95% confidence intervals for regression (grey lines). Values are mean ±s.e.m. for regression equation components. B, illustration of main effect of anodal tDCS on error relationships during and after motor adaptation. Mean values (±s.e.m.; n= 14) for signed error development during motor adaptation (X-axis) and global summed error after adaptation (Y-axis) for the two tDCS conditions. Open circle is sham tDCS and filled circle is active tDCS. C, correlation between signed and summed errors from active tDCS condition only (n= 14). Thick dark line is mean with ± 95% confidence intervals for regression (grey lines). D, correlation between signed and summed errors from sham tDCS condition only (n= 14). Thick dark line is mean with ± 95% confidence intervals for regression (grey lines). Values are mean ±s.e.m. for regression equation components in C and D.

