
Figure 2.
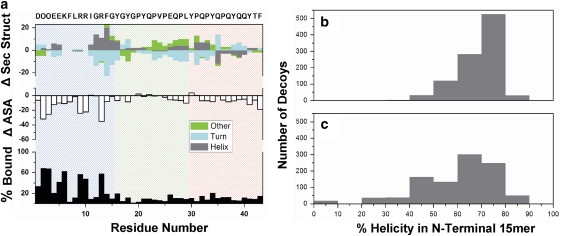
Predicted binding and structural statistics for statherin adsorbed to HAp. (a) Three adsorption phenomena plotted against residue for the 100 top-scoring decoys adsorbed to the (001) surface. The upper panel shows the average change in secondary structure upon adsorption. The middle panel shows the average change in solvent-accessible surface area (Å2) upon adsorption. The lower panel shows the adsorption frequency. Background shading (blue, green, and red) indicates the defined statherin segments (N-terminal, middle, and C-terminal respectively). Statherin amino-acid (one-letter code) sequence plotted along upper x axis. (b) Histogram showing distribution of N-terminal helicity for 1000 top-scoring and (c) 1000 randomly selected decoys.