
Figure 2.
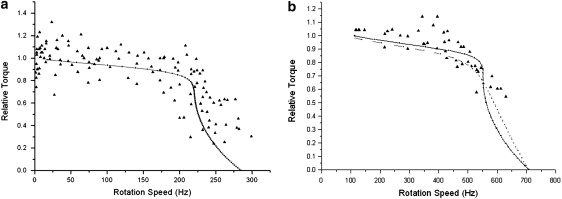
Experimental (triangles) and calculated (solid lines) torque-speed curves for (a) the E. coli H+ and (b) the chimera BFM motors. Normalized torque is used in both figures. In b, we show two model predictions, where the solid line describes the same transition-assisting window as used in E. coli fitting, and the dashed line describes a uniform transition window.