
Figure 3.
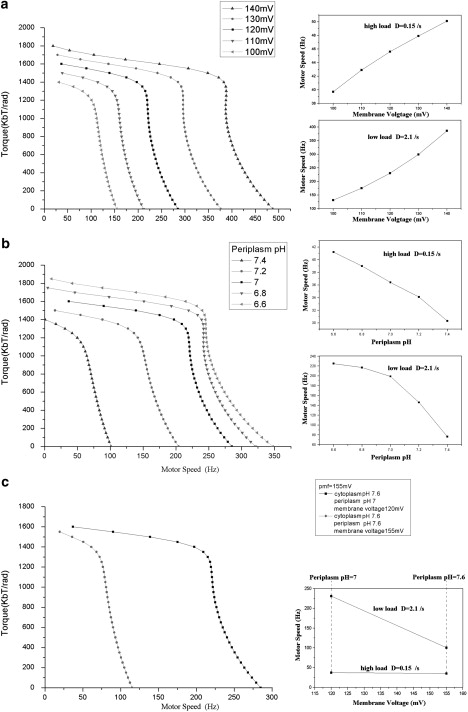
Different effects of the two energy components on E. coli motor dynamics. (a) Effect with fixed ion concentrations but varying membrane potential, showing motor speed versus membrane voltage along a high-load (D = 0.15 rad2/s) line (upper inset) and along a low-load (D = 2.1 rad2/s) line. (b) Effect with fixed membrane potential but varying external ion concentration, showing motor speed versus periplasm pH along a high-load (D = 0.15 rad2/s) line (upper inset) and along a low-load (D = 2.1 rad2/s) line (lower inset). (c) Effect with fixed IMF but different portions of membrane potential and ion concentration difference, comparing the motor speed at high load and low load with fixed IMF. Here we show results for the H+ motor. Similar results are obtained for the chimera motor.