

Abstract
A phosphorylated, single cysteine mutant of nucleoside diphosphate kinase, labeled with N-[2-(iodoacetamido)ethyl]-7-diethylaminocoumarin-3-carboxamide (P∼NDPK-IDCC), was used as a fluorescence probe for time-resolved measurement of changes in [MgADP] during contraction of single permeabilized rabbit psoas fibers. The dephosphorylation of the phosphorylated protein by MgADP occurs within the lattice environment of permeabilized fibers with a second-order rate constant at 12°C of 105 M−1 s−1. This dephosphorylation is accompanied by a change in coumarin fluorescence. We report the time course of P∼NDPK-IDCC dephosphorylation during the period of active isometric force redevelopment after quick release of fiber strain at pCa2+ of 4.5. After a rapid length decrease of 0.5% was applied to the fiber, the extra NDPK-IDCC produced during force recovery, above the value during the approximately steady state of isometric contraction, was 2.7 ± 0.6 μM and 4.7 ± 1.5 μM at 12 and 20°C, respectively. The rates of P∼NDPK-IDCC dephosphorylation during force recovery were 28 and 50 s−1 at 12 and 20°C, respectively. The time courses of isometric force and P∼NDPK-IDCC dephosphorylation were simulated using a seven-state reaction scheme. Relative isometric force was modeled by changes in the occupancy of strongly bound A.M.ADP.Pi and A.M.ADP states. A strain-sensitive A.M.ADP isomerization step was rate-limiting (3–6 s−1) in the cross-bridge turnover during isometric contraction. At 12°C, the A.M.ADP.Pi and the pre- and postisomerization A.M.ADP states comprised 56%, 38%, and 7% of the isometric force-bearing AM states, respectively. At 20°C, the force-bearing A.M.ADP.Pi state was a lower proportion of the total force-bearing states (37%), whereas the proportion of postisomerization A.M.ADP states was higher (19%). The simulations suggested that release of cross-bridge strain caused rapid depopulation of the preisomerization A.M.ADP state and transient accumulation of MgADP in the postisomerization A.M.ADP state. Hence, the strain-sensitive isomerization of A.M.ADP seems to explain the rate of change of P∼NDPK-IDCC dephosphorylation during force recovery. The temperature-dependent isometric distribution of myosin states is consistent with the previous observation of a small decrease in amplitude of the Pi transient during force recovery at 20°C and the current observation of an increase in amplitude of the ADP-sensitive NDPK-IDCC transient.
Introduction
Myosin cross-bridge cycling in contracting muscle is driven by hydrolysis of MgATP and is characterized by close coupling between mechanical and biochemical events in the actomyosin (A.M) cross-bridge cycle. Inferences about the coupling of contraction mechanics and biochemistry have come from kinetic measurements in solution using myosin subfragment 1 (1,2) and from studies relating structural and mechanical events using contracting intact and permeabilized fibers (3–6). Integration of such solution and fiber approaches is important for advancing our understanding of how the release of MgATP hydrolysis products (Pi and MgADP) relate to mechanical events during cross-bridge cycling.
Evidence in support of the view that the MgADP release step(s) in the cross-bridge biochemical cycle control unloaded shortening velocity and limit turnover when cross-bridges are under high strain was recently reviewed by Nyitrai and Geeves (7). For example, the correlation between maximum shortening velocity in fibers and the rate constant of ADP release from myosin in solution suggests that the ADP release rate in unloaded free myosin is likely to be similar to that expected in fibers when cross-bridges are under low mechanical loads (1,7). Dissociation of ADP from cross-bridges may control shortening velocity in both fast and slow myosin isoforms at physiological temperature (8). Experiments in permeabilized fibers at low temperature (≤22°C) together with models of A.M kinetics suggest that the MgADP release steps are relatively slow during isometric contraction (with rate constants ranging from 2 to 12 s−1) and are likely to be rate-limiting for the cross-bridge biochemical cycle (1,6–13).
Previous determinations of MgADP release in permeabilized fibers were made by monitoring the fluorescence change associated with the oxidation of NADH in the presence of excess pyruvate kinase (PK) and lactate dehydrogenase (LDH). Pyruvate production in the PK reaction is driven by the appearance of MgADP in the fiber, and in turn pyruvate drives the oxidation of NADH in the LDH reaction (9–14). Fluorescence response time is limited by flux through the linked enzymes (10) and by diffusion of NADH into the active fiber volume (9,12,13), although the latter is avoided if the fluorescence is monitored within the fiber volume when it is immersed in silicone oil (10,11). Nevertheless, the linked-enzyme approach has been an important integrative probe of ADP release in contracting fibers. For example, recent studies with single fibers from rabbit psoas muscle showed that the steady-state rate for MgADP release during high shortening velocity was ninefold faster than the steady-state rate determined during isometric contraction (11,14). During isometric contraction, permeabilized rabbit psoas fibers in silicone oil had somewhat higher MgADP release rates (ranging from 6 to 12 s−1 at 20°C (10,11,14)) than measurements made on fibers in aqueous bathing solutions. The low end of the range of values determined in silicone oil (i.e., 6 s−1 (11)) was integrated into a recent cross-bridge scheme that accounted for the time courses of isometric contraction and force redevelopment in shortening-restretch protocols in rabbit psoas fibers (6).
The linked-enzyme NADH-dependent MgADP assay is best suited to determinations of MgADP release over relatively long periods (1–20 s) of near steady-state MgATP hydrolysis. It lacks the sensitivity and time resolution to resolve micromolar and transient changes in MgADP release directly. Previous comparisons of the linked-enzyme assay with time-resolved Pi release in permeabilized fibers and with heat + work output in intact fibers highlighted that the linked-enzyme approach gave similar steady-state estimates of myosin ATPase energy output during isometric contraction (10,15). However, the ability to monitor rapid changes in the time course of MgATP hydrolysis products is important to elucidate the integrative properties of cross-bridge mechanics and biochemistry during the approach to steady state, during the force-recovery phases after quick release of cross-bridge strain, and during contractile events at physiological temperatures.
In this study we tested the use of a phosphorylated D112C mutant of nucleoside diphosphate kinase labeled with N-[2-(iodoacetamido)ethyl]-7-diethylaminocoumarin-3-carboxamide (IDCC) to monitor real-time changes of [MgADP] in contracting, single permeabilized skeletal muscle fibers (16). A single cysteine (Cys112) provides a position to attach a single, environmentally sensitive, coumarin-based fluorophore, and the fluorescence of the adduct molecule (NDPK-IDCC) increases by fourfold when phosphorylated at His117. The normal function of NDPK in cells is to equilibrate the nucleotide pool; it catalyzes the transfer of the γ-phosphate group of one nucleoside triphosphate to another with little specificity for the base (16). In permeabilized muscle fibers, in which the nucleotide pool can be controlled experimentally, the probe is sensitive to the MgADP/MgATP ratio. In the presence of relatively small concentrations of P∼NDPK-IDCC in fibers (e.g., 60 μM in this study), the fluorescence change can be monitored during the formation of free MgADP associated with contraction. Kinetics studies with P∼NDPK-IDCC in solution have shown that the binding rate constant for MgADP is 2.3 × 10⁵ M−1s−1 (16), so the rate of fluorescence decrease is ∼50 s−1 in the presence of 200 μM MgADP (16). The rate of this ADP-sensitive fluorescence decrease was approximately doubled in the presence of 1 mM MgATP. In this study, we monitored the time course P∼NDPK-IDCC fluorescence change in single, permeabilized, rabbit psoas fibers after activation from rigor by laser flash release of MgATP (1.3 mM) from the P3-1-(2-nitrophenyl)ethyl ester of ATP (NPE-caged ATP). Our aim was to monitor simultaneously real-time changes in fiber force and P∼NDPK-IDCC dephosphorylation during isometric contraction and during the period after quick release of fiber length (by 0.5%), and to examine the effect of temperature on these processes. Our hypothesis, based on the prediction from cross-bridge theory (17) that MgADP release controls cross-bridge strain, is that MgADP-driven NDPK-IDCC fluorescence change will accelerate transiently and reflect the temperature sensitivity of force recovery as cross-bridge strain redevelops after quick release.
Materials and Methods
IDCC labeling and phosphorylation of NDPK
Production and isolation of the D112C mutant of nucleoside diphosphate kinase (NDPK), and its labeling with IDCC and phosphorylation by ATP were carried out according to Brune et al. (16). Two minor changes were made to the fluorescence labeling protocol: 1), NDPK was first treated for 15 min at room temperature with a twofold molar excess of dithiothreitol (DTT) to maximize thiol group availability after long-term storage at −80°C; and 2) the NDPK was separated from the DTT using a G25 Sepharose gel filtration column (80 mL) that had been equilibrated with 60 mM TES and 1 mM MgCl2 (4°C, pH 7.1). The optical density (OD) of the eluate (2 mL min−1) was monitored continuously at 280 nm to identify the NDPK. [NDPK] was measured spectroscopically as described previously (16). A 2.5-fold molar excess of IDCC, as a concentrated solution (20 mM) in N,N-dimethylformamide, was added dropwise to the NDPK solution. The mixture was stirred at room temperature in a darkened vial for 3 h. The solution was then passed through a 0.2 μm Whatman (Maidstone, UK) syringe filter and concentrated using Millipore (Bedford, MA) Centricon YM-10 centrifugation filters (5000 g for 90 min at 4°C). The labeled protein, NDPK-IDCC, was separated from the remaining free IDCC using the G25 Sepharose column.
Phosphorylation of the NDPK-IDCC was achieved by incubating the protein (30 min, 30°C) in a 15-fold molar excess of ATP in 20 mM TES, 1 mM EDTA, and 1 mM MgCl2. The mixture was applied to the G-25 Sepharose column to separate protein and nucleotides. Fractions that made up the P∼NDPK-IDCC peak were combined and concentrated as described above. The concentration of the protein was determined from spectrophotometric scans (250–600 nm) as described previously (16). The final concentration of P∼NDPK-IDCC was generally 350–400 μM. The labeled protein was stored as 12–20 μL aliquots at −80°C.
Fiber preparation
Female New Zealand white rabbits were killed with an overdose of pentobarbital according to the Animals (Scientific Procedures) Act 1986, Schedule 1. Several bundles of muscle fibers (1–2 mm in diameter, 4–5 cm long) were dissected from the psoas major. Fibers were permeabilized and stored (−20°C) at their in vivo relaxed length as described previously (10,18,19). Single psoas fiber segments were dissected from the muscle bundles in relaxing solution (Table 1) chilled (5°C) on a thermostated stage of a dissecting microscope. Aluminum foil T-clips were placed on the fiber ends and the ends were then treated with 0.5% glutaraldehyde in calcium-free rigor solution (see Table 1) as described previously (19). Fiber segments ranged from 3.5 to 4.5 mm in length and from 60 to 100 μm in diameter. The fibers were either used immediately or stored overnight (−20°C) in a relaxing solution made up in 50% glycerol.
Table 1.
Composition of solutions used to activate permeabilized psoas fibers
| Relaxing solutions |
Rigor solutions |
Loading solutions |
||||
|---|---|---|---|---|---|---|
| Standard | Low ATP | Ca2+-free | Ca2+ | P∼NDPK-IDCC | NPE-caged ATP | |
| TES | 60 | 60 | 60 | 60 | 60 | 60 |
| MgCl2 (1) | 8.66 | 3.86 | 4.50 | 2.02 | 2.02 | 5.63 |
| CaEGTA (2) | 0 | 0 | 0 | 30 | 30 | 30 |
| EGTA | 20 | 20 | 30 | 0.25 | 0.25 | 0.21 |
| Na2ATP | 5.43 | 0.22 | 0 | 0 | 0 | 0 |
| Caged ATP (3) | 0 | 0 | 0 | 0 | 0 | 5.0 |
| P∼NDPK-IDCC | 0 | 0 | 0 | 0 | 0.060 | 0.060 |
| Glutathione | 20 | 20 | 20 | 20 | 20 | 20 |
| BDM | 10 | 10 | 10 | 0 | 0 | 0 |
| Kprop (4) | 23.11 | 50.51 | 20.58 | 23.25 | 23.25 | 1.68 |
| Apyrase (U/mL) | 0 | 0 | 10 | 10 | 0 | < 2 |
Concentrations in mM unless indicated otherwise. All reagents were purchased from Sigma-Aldrich, Gillingham, UK.
Abbreviations: TES, N-tris[hydroxymethyl]ethyl-2-aminoethanesulfonic acid; EGTA, 1,2-Di(2-aminoethoxy)ethane-N,N,N,′N′-tetra-acetic acid; P∼NDPK-IDCC, phosphorylated nucleoside diphosphate kinase labeled with N-[2-(iodoacetamido)ethyl]-7-diethylaminocoumarin-3-carboxamide; NPE-caged ATP, P3-1-(2-nitrophenyl)ethyl ester of ATP; BDM, 2,3-butanedione 2-monoxime; Kprop, potassium propionate.
(1) Concentration corresponding to free [Mg2+] 2.0 mM, (2) concentration corresponding to free [Ca2+] 32 μmol.L−1, (3) concentration giving [MgATP] 1.3 mM after flash, (4) concentration giving the ionic strength (150 mM).
Single fiber segments were mounted between hooks attached at one end to a force transducer (AE801; SensorOne, Sausalito, CA) and at the other end to a motor made from a loudspeaker coil (8Ω, 40 mm diameter; RS Components, Corby, UK) and controlled with a TGA-1241 wave generator (TTi, Huntington, UK). The motor was described in detail elsewhere (18). After a 30 min treatment with 1% Triton-X 100 in relaxing solution, the fiber was washed (in relaxing solution). The fiber length and diameter were recorded by microscopic inspection after the sarcomere length (SL) was set to 2.4 μm.
Fiber activation and quick release
Fibers were taken through a sequence of solution changes (see Table 1) in the 30 μL troughs of a stainless-steel temperature-controlled (12 or 20°C) stage of a Zeiss (Jena, Germany) ACM upright microscope. The solutions outlined in Table 1 were used to prime the fiber for activation (addition of 32 μM Ca2+, 5 mM NPE-caged ATP) and to monitor P∼NDPK-IDCC fluorescence. Immersion of the fiber into a low-ATP relaxing solution reduced the ATP gradient in the center of the fiber. This step was included to preserve sarcomere structure upon switching the fiber into Ca2+-free rigor solution by minimizing the delay in rigor cross-bridge formation between the fiber periphery and its core as ATP diffused out of the fiber. Turnover of myofibrillar ATPase, which would contribute to changes in purine nucleotide concentrations, was minimized by the inclusion of 10 mM 2,3-butanedione 2-monoxime (BDM) in the prerigor and subsequent Ca2+-free rigor solutions (Table 1). The presence of BDM also helped to minimize the rigor force that developed (20) in the Ca2+-free rigor solution. Rigor force generally stabilized within 2–5 min at <5% of peak isometric force. Apyrase (10 U mL−1) was included in the sequence of Ca2+-free and Ca2+ rigor solutions to deplete the fiber of residual nucleotide di- and triphosphate. The fiber was then immersed in two consecutive Ca2+ rigor solutions for 5 min each to maintain saturating [Ca2+] while washing apyrase out of the fiber. Continuous sinusoidal length changes (1–5 Hz; amplitude ± 0.25% of total length) were imposed on the fibers at this stage to assist the apyrase washout by stirring. The fiber was immersed for 5 min in each of the “loading solutions” (Table 1), which contained the P∼NDPK-IDCC and the NPE-caged ATP. A low level of apyrase (<2 U mL−1) was used in the NPE-caged ATP loading solution to break down any residual free ADP and ATP.
Finally, the fiber was transferred into silicone oil (10 centistokes; Dow Corning, Coventry, UK) in a trough constructed of quartz to enable monitoring of fluorescence and SL changes during activation (10,21,22). The fiber was then activated by laser-flash photolysis of NPE-caged ATP using a 30 ns laser pulse of 100–150 mJ (QSR 2; Lumonics, Rugby, UK), which released ATP at 46 s−1 at 12°C and 102 s−1 at 20°C (23). A high-performance liquid chromatography analysis of photolyzed loading solutions showed that 1.3 mM free ATP was released from 5 mM of NPE-caged ATP. Details of the epifluorescence microscope and the fluorescence monitoring system are provided elsewhere (10,21,22).
One modification of the methods used previously (10,15) was that excitation of the P∼NDPK-IDCC was achieved by illuminating the fiber with blue light (440 ± 5 nm) from a constant-wavelength 4 mW laser source (Power Technologies, Little Rock, AR). Excitation of P∼NDPK-IDCC with the blue laser produces fluorescence records with a superior signal/noise ratio compared to records produced with filtered light from a xenon lamp. The improved fluorescent signal is important for detecting small changes in the rate and amplitude of product release during periods of force redevelopment after the quick release of fiber strain.
When the force reached its plateau level, a quick release was imposed (0.5% of fiber length). Quick releases were triggered at either 200 or 300 ms after fiber activation by photolytic release of ATP from NPE-caged ATP. Records of NDPK-IDCC fluorescence and fiber force were collected at 5 kHz (VirtualBench-Scope; National Instruments, London, UK) and changes in fiber SL were collected at 1–2 kHz (EGAA Computerscope; R.C. Electronics, Goletta, CA).
Calculating the time course of NDPK appearance
Fluorescence intensity of P∼NDPK-IDCC declines when phosphate is transferred to MgADP. In our experiments, changes in [NDPK-IDCC]/[ P∼NDPK-IDCC + NDPK-IDCC] are related to the fractional fluorescence, which is the fluorescence change, ΔFl, divided by the maximum observed fluorescence change, ΔFlmax):
| (1) |
Equation 1 shows that when all of the NDPK-IDCC is phosphorylated, the fractional fluorescence change is zero. Ideally, this condition exists before activation of the fiber. The fluorescence declines when MgADP is added to the system and P∼NDPK-IDCC is dephosphorylated. During contraction, the fractional fluorescence eventually reaches a value of one as total [NDPK-IDCC] becomes predominantly dephosphorylated. In our experiments, the total NDPK-IDCC concentration in the fiber was 0.060 mM. The time course of [NDPK-IDCC] appearance was determined by substituting 0.060 mM for the total fluorophore concentration into Eq. 1, and then rearranging:
| (2) |
The time course of P∼NDPK-IDCC dephosphorylation indicates changes in [MgADP] during isometric contraction and during recovery of force after quick release of cross-bridge strain. Here we show the time course of NDPK-IDCC appearance calculated from the fluorescence signal. We then model the NDPK-IDCC kinetics to derive the time course of ADP release (see Results) during force recovery.
kobs and Keq for NDPK-IDCC
The fluorescence changes during dephosphorylation of P∼NDPK-IDCC at 20°C determined previously (16) showed that the second-order rate constant for dephosphorylation is ∼105 M−1s−1, and the rate constant for fluorescence change is 125–230 s−1 for [MgADP] between 0.5 and 1 mM. Here we determined the rate constants for P∼NDPK-IDCC dephosphorylation at 12°C. We used photolysis of NPE-caged ADP in the presence of 1 μM P∼NDPK-IDCC to vary the free concentration of MgADP in fibers between 98 and 475 μM. Data reported by Khromov et al. (24) imply that at 20°C and pH 7.1 the rate constant for photolytic release of ADP from NPE-caged ADP must be >300 s−1. The Q10 for NPE-caged-ADP photolysis is likely to be similar to that for NPE caged-ATP (23), so the rate of ADP release at 12°C is likely to be >100 s−1. The time courses of protein dephosphorylation were fit with single exponential equations. Linear regression was used to determine the dependence of the rate constants (kobs) on [MgADP] from which a second-order rate constant was derived.
The apparent equilibrium constants at 12 and 20°C were determined from fluorescence records of NDPK-IDCC titrated with mixtures of MgADP and MgATP. The nucleotide concentration ratio, [MgADP]/[MgATP], was varied while maintaining [MgADP + MgATP] at 1.5 mM (16). Assays were conducted in a 5 μL droplet containing 60 μM P∼NDPK-IDCC in Ca2+-free rigor solution, held in a glass capillary (0.78 mm i.d.) and immersed in silicone oil. Fibers were not used, because persistent low-level activity of myosin ATPase affects the proportions of ADP and ATP. Least-squares predictions of ΔFl/ΔFlmax were calculated at varying nucleotide ratios by finding the best value for Keq in the equation of Brune et al. (16):
| (3) |
Analysis of time-dependent P∼NDPK-IDCC dephosphorylation in muscle fibers
Least-squares regression analysis was used to determine the approximately linear rates of P∼NDPK-IDCC dephosphorylation for a period of up to 500 ms just before the quick release step and up to 500 ms immediately after force had redeveloped. Excel Solver (Microsoft, Redmond, WA) was used to fit regression lines to the pre- and poststep NDPK-IDCC time courses. The pre- and poststep P∼NDPK-IDCC dephosphorylation rates were found to be close to each other, as previously found for Pi release before and after quick releases (25). Hence, the difference between the least-squares intercepts for the two linear segments of the time course was an estimate of the extra P∼NDPK-IDCC dephosphorylated during the phase of force redevelopment. Average time courses for [NDPK-IDCC] during the period of force redevelopment were fit by single exponential equations, giving the rate constant for P∼NDPK-IDCC dephosphorylation during this period.
Results
NDPK-IDCC fluorescence kinetics
Fig. 1 illustrates the linear relationship between [MgADP] and kobs for the dephosphorylation of P∼NDPK-IDCC at 12°C in rigor fibers. The second-order rate constant, determined from the slope of the linear regression, was 1.4 × 10⁵ M−1s−1. This is close to the value of 2.3 × 10⁵ M−1s−1 at 20°C determined by Brune et al. (16). The first-order rate constant for MgADP binding with P∼NDPK-IDCC at 12 and 20°C is, therefore, >70 s−1 when [MgADP] exceeds 0.5 mM.
Figure 1.

Dependence of kobs (the observed rate constant for P∼NDPK-IDCC dephosphorylation) on [MgADP] at 12°C. Photolysis of NPE-caged ADP in the presence of 1 μM P∼NDPK-IDCC was used to vary the free concentration of ADP in fibers between 98 and 475 μM. The slope of the regression line through the average (mean ± SE) data points (n = 3) and the origin is 1.4 × 10⁵ M−1s−1.
Fig. 2 depicts the relationship between ΔFl/ΔFlmax and [MgATP]/([MgATP] + [MgADP]) from a titration of varying ratios of MgADP and MgATP into P∼NDPK-IDCC. The best fit values for Keq for P∼NDPK-IDCC + ADP ⇄ ATP + NDPK-IDCC were calculated by using Eq. 3. The average (mean ± SE) Keq was 0.15 ± 0.06 (n = 4) at 12°C and 0.29 ± 0.03 (n = 2) at 20°C.
Figure 2.

Relationships between relative fluorescence and relative ATP concentration used to determine Keq for NDPK-IDCC at 12 (solid circles, n = 4) and 20°C (open circles, n = 2). Keq values, calculated for the best fit to Eq. 3 in Materials and Methods, were 0.15 and 0.29 for 12 and 20°C, respectively.
Force production and NDPK dephosphorylation
An example of the time course for force production, fluorescence, and SL at 12°C is shown in Fig. 3 for a permeabilized muscle fiber activated at time zero by photolytic release of 1.3 mM ATP from 5 mM of NPE-caged ATP. The top panel shows that force increased rapidly to the isometric plateau. At 0.2 or 0.3 s after the photolysis laser pulse, the motor applied a low-amplitude (0.5%) length decrease to the fiber, which was complete in 0.5 ms. During the length step, force first decreased in an elastic response and then recovered to the prestep level within the next 100 ms. The fluorescence signal showed a brief period of increase immediately after photolytic release of ATP (50–80 ms into the time course). This indicates that P∼NDPK-IDCC was dephosphorylated to a small extent before photolysis, and that the fluorescence increase corresponds to a period of rephosphorylation by the photolytically released ATP. Periodic tests of P∼NDPK-IDCC fluorescence in solution indicated that the phosphorylated protein was insensitive to added MgATP, verifying that the phosphorylation state of the frozen stock was stable. Hence, it is likely that partial dephosphorylation of the protein occurred while the fibers were immersed in the loading solutions. This was probably caused by a low concentration of contaminating MgADP within the fiber. For calculations of P∼NDPK-IDCC dephosphorylation, the fluorescence time courses were first adjusted so that the peak of this early signal corresponded to ΔFl = 0.
Figure 3.

Example time courses of force, fluorescence, and SL in a single psoas fiber at 12°C after photolysis of 1.3 mM ATP from NPE-caged ATP at time zero. Quick release of fiber length (by 0.5% of total length) was initiated at 300 ms. Partial dephosphorylation of P∼NDPK-IDCC occurs while the fiber is in rigor solution because of low-level contaminating MgADP in the fiber. The transient rising fluorescent signal, below 100 ms, is rephosphorylation of the sensor by MgATP formed after photolysis of NPE-caged ATP.
The sarcomere signal, derived from diffraction of a laser beam by the sarcomere, does not always faithfully report the small length step; however, the signal does show the overall stability of the fibers during isometric contraction and during recovery from quick release.
Fig. 4 shows the time courses of force production, normalized for cross-sectional area (CSA), and of [NDPK-IDCC] calculated from ΔFl using Eq. 2. The isometric force before quick release averaged (mean ± SE) 261 ± 25 (n = 6) and 347 ± 32 (n = 9) kN·m−2 at 12 and 20°C, respectively (Q10 = 1.4). The amount of extra NDPK-IDCC, generated in response to increased MgADP release during force redevelopment after the release of cross-bridge strain, was the difference in regression intercepts for the parallel lines fit to the time course just before and just after quick release. The average (mean ± SE) amplitude of the [NDPK-IDCC] change after force recovery increased significantly (p < 0.05) with temperature, from 2.7 ± 0.6 μM (n = 6) at 12°C to 4.7 ± 1.5 μM (n = 4) at 20°C for quick releases initiated 300 ms into the contraction. At 20°C, the [NDPK-IDCC] amplitude was 7.0 ± 1.2 μM (n = 4) when quick release was initiated 200 ms into the contraction. The two 20°C groups were not pooled because the difference in NDPK-IDCC amplitude was of borderline significance (p = 0.10).
Figure 4.

Data in Fig. 3 after normalization of force to cross-sectional area (7.86 × 10⁻⁹ m2) and after calculation of [NDPK-IDCC] from ΔFl (Eq. 2). The lower panel shows sections of the time courses for force and [NDPK-IDCC]; best fit regression lines on the NDPK-IDCC time course were fit simultaneously for periods (100 ms) before quick release and after force redevelopment. The difference in the intercepts for the resulting parallel regression lines is the extra NDPK-IDCC (in mM) formed during force redevelopment.
To analyze the kinetics of the NDPK-IDCC time courses during force redevelopment, individual records were first rescaled by subtracting prestep regression values from the observations up to 0.5 s. The resulting time courses (Fig. 5) show the transient monotonic increases in [NDPK-IDCC]. Single exponentials were fit to the NDPK-IDCC time courses to determine the rate constants during force redevelopment. The rate constant for NDPK-IDCC formation at 12°C was 28 s−1, whereas at 20°C the rate constant was 44–50 s−1. The Q10 for the transient acceleration of NDPK-IDCC formation during force recovery ranged between 1.7 and 2.1.
Figure 5.

Average (mean ± SE; shown as gray areas) time courses of force and [NDPK-IDCC] during force redevelopment. Single exponentials (dashed lines) were fit to the average NDPK-IDCC time courses to provide rate constants for NDPK-IDCC generation during force redevelopment after quick release at 300 ms at 12°C (R2 = 0.99; n = 7) and 20°C (R2 = 0.95; n = 4). Also shown (bottom panel) is the NDPK-IDCC transient at 20°C after quick release at 200 ms (R2 = 0.94; n = 4). The rising signal in the prestep period of the bottom panel arises because force and MgADP release are not in steady state this early in the time course. The regression procedure isolates the NDPK-IDCC transient after quick release, but also highlights the nonsteady-state conditions.
Kinetic simulations
The time courses of relative force (force divided by maximum isometric force) and NDPK-IDCC concentration (derived directly from the ΔFl) were simulated using a seven-step reaction scheme (Fig. 6). The time course of [NDPK-IDCC] was calculated directly from the relative ΔFl using Eq. 2. We did not account for the effect on NDPK-IDCC kinetics of a possible significant positive intercept in the relationship between kobs and [MgADP] when [MgATP] is >1 mM (16). Details of the procedures for fitting the model to mechanical and biochemical time courses simultaneously are provided elsewhere (15,25,26). However, we did incorporate some modifications into our approach. We added two isomerization steps into the reaction scheme: 1), a transition of the preforce A.M.ADP.Pi state into the high-force-generating A.M.ADP.Pi′ state; and 2), a transition of the high-force and strain-sensitive A.M.ADP′ state into the A.M.ADP′ state that just precedes ADP release.
Figure 6.

Reaction scheme used to simulate time courses of relative force and NDPK-IDCC concentration. Strong binding (force-producing) states in the scheme are signified by the prime (′) symbol. Postisomerization states in the scheme are denoted by the italicized ATP hydrolysis products (Pi and ADP).
We did not include a creatine kinase-based ATP regenerating system in our experiments because creatine kinase, which phosphorylates MgADP, interferes with reporting of MgADP release by P∼NDPK-IDCC. Total P∼NDPK-IDCC concentration was low (60 μM). We accounted for the MgATP regenerated by phosphotransfer from P∼NDPK-IDCC to MgADP in the model by incorporating forward (k8NDPK-IDCC) and reverse (r8NDPK-IDCC) second-order rate constants for the NDPK-IDCC system at 12 and 20°C (Table 2). In our modeling of 20°C data, we used the forward and reverse rate constants (k8NDPK-IDCC and r8NDPK-IDCC; Table 2) for the NDPK reaction determined by Brune et al. (16). At 12°C, the forward rate constant of 1.4 × 10⁵ M−1s−1 (Fig. 1) was used together with a value of 0.21 × 10⁵ M−1s−1 for the reverse rate constant, making the ratio of forward and reverse rate constants equal to 0.15.
Table 2.
Parameters used to simulate time courses of force and ADP release, and to calculate occupancies of actomyosin states according to the reaction scheme in Fig. 6
| 12°C | 20°C | |
|---|---|---|
| k1 (M−1s−1) | 1.0 × 10⁶ | 2.0 × 10⁶ |
| r1 (s−1) | 75 | 75 |
| k2 (s−1) | 50 | 200 |
| r2 (s−1) | 25 | 150 |
| k3 (s−1) | 270 | 635 |
| r3 (s−1) | 335 | 882 |
| k4 (s−1) | 532 | 873 |
| r4 (s−1) | 540 | 1200 |
| k5 (s−1) | 34 | 106 |
| r5 (M−1s−1) | 20 × 104 | 20 × 104 |
| k6 (s−1) | 3.3 | 6.0 |
| r6 (s−1) | 0.05 | 0.05 |
| k7 (s−1) | 76 | 76 |
| r7 (M−1s−1) | 133 × 103 | 250 × 103 |
| k7cage (M−1s−1) | 20 × 103 | 40 × 103 |
| r7cage (s−1) | 80 | 80 |
| k8NDPK-IDCC (M−1s−1) | 140 × 103 | 230 × 103 |
| r8NDPK-IDCC (M−1s−1) | 21 × 103 | 70 × 103 |
| xk6 | 140 | 378 |
| Tdrop | 0.45 for a 0.5%L step | 0.45 for a 0.5%L step |
| Velocity of shortening (ML s−1) | 1.25 | 6.25 |
| SEC | 8 | 8 |
| GHill | 3.5 | 3.3 |
| Rate of release of ATP from cage (s−1) | 46 | 102 |
| A·M·ADP·Pi′ relative force | 2.5 | 3.0 |
| A·M·ADP′ relative force | 1 | 1 |
| A·M·ADP′ relative force | 1 | 1 |
Parameters in bold were fixed and based on our previous model (25), on the kinetics of P∼NDPK-IDCC dephosphorylation reported by Brune et al. (16) and shown in Fig. 1, ATP release from NPE-caged ATP (23), and some preliminary simulations to find relative force value for A.M.ADP.Pi′. The terms k7cage and r7cage refer to the formation of A.M.caged.ATP (i.e., ∼74% of NPE-caged ATP remains unphotolyzed after the laser flash, and it competes with MgATP for binding to A.M (19)). The parameter xk6 is the factor that accelerates rate of A.M.ADP isomerization leading to MgADP release at zero tension; the rates are therefore 462 s−1and 2268 s−1 at 12 and 20°C, respectively. Tdrop is the relative drop in force due to the quick release step. Velocity of shortening was calculated using an appropriate force-velocity relationship (22) at 12°C (Vmax = 1.25 ML s−1); relative Vmax at 20°C was 6.25 ML s−1 (19); ML is muscle length. A value of 8 (relative Po/Lo) for the SEC of fiber stiffness was found to be best for fitting the rising phases of the force time courses. The term GHill is “a/F” in Hill's hyperbolic equation (38); GHill is used in the calculation of velocity using the equation Velocity = (Vmax× (1 − F))/((1 + F×GHill) × (1 − F)), where F is relative force per cross-bridge calculated as relative force divided by the sum occupancy of the three force-producing cross-bridge states.
A series elastic component (SEC) of fiber stiffness was incorporated into the calculations of the rate of force development on the basis of the force-velocity relationships for 12 and 20°C (19,22,25). A key modification here was that the time course of relative force per cross-bridge (F in equations shown in Table 2) was calculated as the total force divided by the sum of the occupancies of three force-bearing cross-bridge states—A.M.ADP.Pi′, A.M.ADP′, and A.M.ADP′—weighted for their relative forces (see below). Filament sliding was calculated from the force-velocity relationship (Table 2), where force per cross-bridge was the calculated force divided by the sum of the three force-bearing states. The rate constant k6, for transition of A.M.ADP′ into A.M.ADP′, was strain-dependent and free to vary in the simulations, being slow at high strain (isometric) and very fast at low strain. The A.M.ADP′ to A.M.ADP′ isomerization was linked to relative force levels such that at isometric force k6 was 3.3 at 12°C and 6.0 s−1 at 20°C, and during force redevelopment values for k6 were accelerated by the factors 140 and 378 at 12 and 20°C (shown as xk6 in Table 2), respectively.
As explained previously, the relative force of the A.M.ADP.Pi′ state had to be higher than that of A.M.ADP in our simulation (15,25,26) because we could not otherwise account for the displacement-dependent force that is held by an individual cross-bridge. In our simulations, the force assigned to a cross-bridge state was the average force for that particular cross-bridge population. In a more realistic model (beyond the scope of the analysis presented here), force per individual cross-bridge varies with its displacement (17). It is assumed that 1), the A.M.ADP population(s) will be at a smaller average displacement than A.M.ADP.Pi population(s); and 2), transitions from the A.M.ADP.Pi′ state to the preisomerization A.M.ADP′ state are promoted by the smaller cross-bridge displacements. The two A.M.ADP populations hold lower average force than predicted in the unrealistic situation where transition of A.M.ADP.Pi′ into A.M.ADP′ occurs without any change in displacement. A relative force value of 1.0 was assigned to each of the two A.M.ADP states and we explored higher force for A.M.ADP.Pi′. In previous models of the time courses of force and Pi release in rabbit psoas fibers, the value for this parameter was between 2 and 3 (25). Here the rate constants shown in Table 2 were generated with the A.M.ADP.Pi′ relative force set at 2.5 and 3.0 for 12 and 20°C simulations, respectively.
As in our previous experiments, fibers were activated from the rigor state by photolytic release of ATP, at rates of 46 and 102 s−1 at 12 and 20°C, respectively. We assumed that the myosin head concentration is 0.15 mM (10) and that 100% of the heads were in the rigor A.M state before activation. Redistribution of myosin states occurred rapidly after ATP binding. Occupancy of the A.M state decreased and rapidly became a relatively small proportion of the total population of states as force proceeded toward its isometric peak, as is shown for simulations at 12°C in Fig. 7. The values for the forward and reverse rate constants for release of ATP from NPE-caged ATP, for ATP binding to A.M, and for ATP hydrolysis (Table 2) were obtained from Siththanandan et al. (25), including the temperature coefficients used in their simulations of force and Pi release. Results for the simulated and observed quick releases at 12 and 20°C are compared in Fig. 8.
Figure 7.

Simulations of force and NDPK-IDCC concentration at 12°C, showing the time courses of A.M state occupancies (upper panel) and the fits to relative force and NDPK concentration (lower panel).
Figure 8.

Modeled time courses of force and NDPK-IDCC concentration during recovery from quick release at 12 and 20°C.
Simulations indicate that initial force development at 12°C followed the increase in occupancy of the A.M.ADP.Pi′ and A.M.ADP′ states (Fig. 7). However, in the steady-state period before quick release, occupancy of the postisomerization A.M. ADP′ had declined (Fig. 7) and accounted for only 6% of the total force-bearing states. The preisomerization A.M.ADP′ state was populated gradually and became the dominant ADP-containing state just before quick release at low temperature (Figs. 7 and 9). This state depopulated by ∼60% upon quick release. The postisomerization A.M.ADP′ state showed a transient increase in occupancy during force recovery (Fig. 9).
Figure 9.
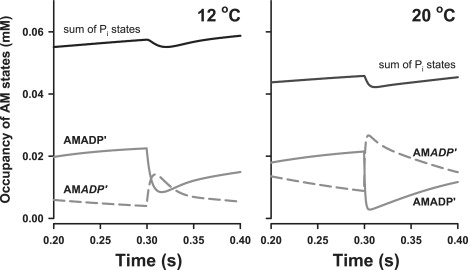
Time courses of bound A.M states at 12 and 20°C from simulations of quick release at 300 ms. Occupancies depicted are those for sum of the two bound Pi states (black lines) and for the A.M.ADP′ (solid gray lines) and A.M.ADP′ (dashed gray lines).
The summed occupancy of the A.M.ADP.Pi + A.M.ADP.Pi′ states in the period just before quick release was 20% lower at 20°C than at 12°C (Fig. 9). This was primarily because of reduced occupancy of the A.M.ADP.Pi′ state, which was 58% of the total force-bearing states at 12°C compared to 37% of the force-bearing states at 20°C. Occupancy of the postisomerization A.M.ADP′ state was higher at 20°C than at 12°C during the steady-state period before quick release (Fig. 9). The A.M.ADP′ state made up 7% of force-bearing states at 12°C, compared with 19% at 20°C. At the higher temperature, the preisomerization A.M.ADP′ state depopulated rapidly upon quick release to ∼10% occupancy (Fig. 9).
The simulations suggest that during isometric contraction, the strongly attached, force-bearing states (A.M.ADP.Pi′ + A.M.ADP′ + A.M.ADP′) accounted for 36% of the total myosin states at 12 and 20°C. Attached states, including the weakly bound A.M.ADP.Pi state, made up 55% and 51% of the total A.M states at 12 and 20°C, respectively (Fig. 9).
Discussion
To our knowledge, this is the first report of the use of the NDPK-IDCC biosensor to study strain-dependent biochemical and mechanical events in permeabilized skeletal muscle fibers. The main conclusions are as follows: 1) P∼NDPK-IDCC dephosphorylation reports MgADP release resulting from MgATP hydrolysis in contracting muscle fibers with micromolar sensitivity and with a time resolution in the region of 10 ms. 2) Quick release of fiber length (0.5%) caused a transient increase in the rate of MgADP release from the cross-bridges, as indicated by the increased NDPK-IDCC signal during the period of force recovery. 3) Simulations suggest that the time courses of the NDPK-IDCC signal and force recovery after quick release are explained chiefly by redistribution of the pre- and postisomerization A.M.ADP states (Fig. 9).
The modeling results suggest that changes in the [MgADP] during isometric contraction covered the range of cytosolic free [MgADP] values expected for intact mammalian skeletal muscle in the presence of typical Pi concentrations. The simulations show that before quick release, [MgADP] increased to ∼100 and ∼300 μM at 12 and 20°C, respectively. In intact skeletal muscle, free [MgADP] is likely to remain in the range of 15–100 μM during repeated isometric contractions at temperatures of 30–37°C (27,28). Normally, the concentration of MgADP is kept low in the vicinity of the cycling cross-bridges in vivo because of the combined activity of creatine kinase and adenylate kinase. Since we could not buffer MgADP in our experiments, the rate of myosin ATPase was sensitive to the declining concentration of ATP. Nevertheless, it is clear that the mechanical and biochemical time courses (Figs. 3–5) developed up to the point of quick release through a physiologically relevant range of [MgADP] values. Similarly, Pi accumulation is expected to proceed through a physiological range. Therefore, a key advantage of resolving MgADP kinetics using the P∼NDPK-IDCC probe in permeabilized fibers is that one can evaluate the kinetic mechanisms that integrate cross-bridge mechanics and biochemistry in a preparation that is close to conditions in the intact fiber.
Simulations indicate that the three strongly bound, force-bearing states make up about one-third of the total actomyosin states during isometric contraction at both 12 and 20°C, suggesting that changes in force generation within this temperature range are due to altered force per cross-bridge. At the lower temperature, these three states show quite different occupancies just before quick release: A.M.ADP.Pi′, A.M.ADP′, and A.M.ADP′ made up 56%, 38%, and 7%, respectively, of the total strongly bound states at 12°C. The postisomerization A.M.ADP′ state made a relatively small contribution to the plateau isometric force at 12°C. In contrast, all three strongly bound states were important for isometric force production at 20°C: the A.M.ADP.Pi′ and A.M.ADP′ states made up 37% and 44% of the total strongly bound states, and the contribution of A.M.ADP′ increased to 19%. The lower occupancy of A.M.ADP.Pi′ and elevated occupancy of A.M.ADP′ at the higher temperature agrees with our previous simulations of force and Pi release (25) after quick release of cross-bridge strain at 12 and 20°C. The temperature-dependent distributions of force-bearing states before quick release is consistent with the observations that the Pi transient is lower (25) and the ADP transient higher (Fig. 10) at 20°C than at 12°C (see also the discussion below about temperature sensitivity). It is possible that the postisomerization A.M.ADP′ state, which was 7% of the total force-bearing states at 12°C and 19% at 20°C, becomes increasingly populated at physiological temperatures. Increased accumulation of A.M.ADP′ may partly explain the observation that isometric force is reduced to a lesser extent by Pi buildup when measured at, or near to, physiological temperatures (15,26,29), considering that reversal of the transition of A.M.ADP′ to A.M.ADP′ is not favored (i.e., r6 = 0.05 s−1; Table 2), and assuming that Pi buildup interacts with the preisomerization A.M.ADP′ state to reduce cross-bridge attachment (i.e., increased reversal of steps 3–5 in the kinetic scheme; Fig. 6).
Figure 10.

Simulations of the time courses of MgADP release in single psoas fibers at 12 and 20°C. The rates of ADP release during isometric contraction (immediately before quick release of tension at 0.3 s) were 0.35 mM s−1 at 12°C and 1.2 mM s−1 at 20°C, and the amplitudes of the MgADP transients were 27 and 63 μM at 12 and 20°C, respectively.
Kinetics of NDPK-IDCC formation
The rate of NDPK-IDCC dephosphorylation at different concentrations of MgADP was measured under the experimental conditions for laser-flash activation of fiber contraction. The value of the second-order rate constant for this process determined within the filament matrix of single permeabilized fibers at 12°C was 1.4 × 10⁵ M−1s−1. This is close to the value of 2.3 × 10⁵ M−1s−1 obtained at 20°C from experiments with rapid mixing of MgADP and P∼NDPK-IDCC (16). The Keq value of 0.29 for NDPK-IDCC, determined at 20°C in a glass capillary that mimicked the size and shape of a single psoas fiber, was similar to the ratio of rate constants for P∼NDPK-IDCC dephosphorylation and NDPK-IDCC phosphorylation determined previously in the rapid-mixing assays. The second-order rate constants and Keq values provided constraints for assigning values to the forward and reverse rate constants for the NDPK system in our simulations (Table 2).
When [MgADP] exceeds 0.5 mM, the rate of change in fluorescence, ΔFl, was >150 s−1 at 20°C in the rapid-mixing studies (16) and >70 s−1 in permeabilized fibers (Fig. 1) at 12°C. However, in fibers the value for kobs is lower (<20 s−1) when [MgADP] is close to that predicted at the time of the quick release at 12°C (e.g., 0.1 mM; Fig. 10). The kobs value is similar to the rate of NDPK-IDCC appearance calculated during force recovery at 12°C (28 s−1; Table 2). This is likely to account for the finding that the NDPK-IDCC fluorescence signal, at both temperatures, lagged behind the true time course of [MgADP] buildup in our experiments. Calculations of MgADP release, assuming very rapid dephosphorylation of P∼NDPK-IDCC, will only be valid for near steady-state MgADP release (e.g., just before quick release). However, the time course of P∼NDPK-IDCC dephosphorylation, calculated directly from the ΔFl signal (Eq. 2), provides a model-based estimate of transient MgADP release (Fig. 10) during nonsteady-state phases of force recovery.
MgADP release during isometric contraction
The average isometric forces were 261 ± 25 and 347 ± 32 kN·m−2 at 12°C and 20°C, respectively. These forces are ∼20% higher than those determined in previous experiments (25) in which Pi release was measured using a coumarin-labeled phosphate binding protein (MDCC-PBP). Tight binding of Pi to MDCC-PBP in the matrix of permeabilized skeletal muscle fibers causes fluorescence of the probe to increase by ∼4-fold. The slightly higher isometric force in this study was unexpected to some extent, considering that the presence of MDCC-PBP reduces accumulation of free Pi during force generation (10,25), and that the presence of as little as 200 μM Pi can reduce isometric force (30). In this study, the inclusion of BDM (10 mM) in calcium-free rigor solution (Table 1) lowered rigor tension to <5% of active tension (e.g., see Fig. 4), and it is possible that lower rigor tension preserved sarcomere structure and improved active force generation. The relative temperature-sensitive increases in average peak force observed in this study and the previous parallel study (25) were similar (32% vs. 28%, respectively).
The time course of MgADP release at the beginning of contraction was obscured during an initial period of NDPK-IDCC rephosphorylation, as indicated by the transient rise in the ΔFl immediately after activation of the fibers (Fig. 3). Release of MgADP from rigor cross-bridges may be a key determinant of the NDPK-IDCC phosphorylation state before the photolysis of NPE-caged ATP. Although A.M affinity for MgADP in skeletal muscle is in the range of hundreds of micromolar (8) and contamination by MgADP was minimized by apyrase treatment (see Table 1), it remains likely that dephosphorylation of P∼NDPK-IDCC occurred as a result of slow MgADP release while fibers were immersed in the NDPK-IDCC and NPE-caged ATP loading solutions. The P∼NDPK-IDCC probe is sensitive to changes in [MgADP] much lower than 100 μM, so even a low-level accumulation of MgADP in rigor fibers results in partial dephosphorylation of P∼NDPK-IDCC. In contrast, photolytic release of 1.3 mM ATP rapidly reduced the MgADP/MgATP ratio in the fiber matrix, and in turn favored transient rephosphorylation of NDPK-IDCC before there was significant buildup of the MgADP released from cycling cross-bridges.
Rephosphorylation of the sensor at the onset of isometric contraction also affects the experimental time course of MgADP release and should be accommodated for in the modeling. However, the calculated time courses of MgADP release and force show a gradual slowing of MgADP buildup as the force time course progressed (Fig. 9 and Fig. 10). This is not unexpected, as the MgATP concentration declines in the absence of a creatine-kinase ATP backup system and Pi and MgADP increase during the contraction. Similar patterns of Pi release and heat + work measurements are observered in permeabilized and intact fibers, respectively (10,15,25). Moreover, the near steady-state rates (before quick release and after force recovery) of MgADP release in fibers calculated from the modeled time courses (0.35 mM s−1 at 12°C and 1.2 mM s−1 at 20°C) are similar to the steady-state Pi release rates measured with MDCC-PBP (e.g., 1.3 mM s−1 at 20°C (25)) and to steady-state MgADP release rates measured using a fluorescent NADH oxidation assay (e.g., 0.31 mM s−1 at 10°C (11)). Additionally, the average rate of MgADP release determined in fibers that were relaxed from the rigor state (by photolysis of NPE-caged ATP in Ca2+-free fibers) was ∼0.008 mM s−1 (n = 2; data not shown) at 12°C. This was ∼2% of the near steady-state rate of MgADP release during isometric contraction, and was comparable to the resting ATPase activity (0.006 mM s−1 at 10°C) measured previously in rabbit psoas fibers by means of NADH fluorescence (11).
The main contrast with previous time-resolved ATPase measurements is in the amplitudes of product release during isometric contraction. The modeled amplitudes of MgADP release are lower than those obtained in similar previous assays that measured Pi release using MDCC-PBP in permeabilized fibers and heat + work measurements in intact fibers (10,15,25). For example, after 300 ms of isometric contraction at 12°C, the modeled amplitude of the MgADP concentration was ∼100 μM, whereas the previous measured and modeled change in Pi concentration was ∼600 μM (25). The discrepancy likely reflects, in part, the fact that the brief period of NDPK-IDCC rephosphorylation in this study obscured the very early rise in [MgADP] and hence the increase in [NDPK-IDCC]. The main factor is that in previous experiments with MDCC-PBP, the Pi concentration was kept at a low level (micromolar) throughout the measurement period (31), whereas here the Pi concentration was more physiological and likely to rise to the millimolar range during contraction.
MgADP release during force recovery at 12°C
A rapid 0.5% (6 nm per half sarcomere) release of fiber length during isometric contraction transiently reduces force and eases the strain on strongly bound cross-bridges. Temporary relief of the strain-dependent rate limitation on cross-bridge cycling resulted in a transient increase of phosphotransfer from P∼NDPK-IDCC as fiber force redeveloped after the length step. This response is expected to be directly related to the transient strain-dependent stimulation of MgADP release (2,6–8,14,15,25). In the models presented here (Table 2), we included an irreversible A.M.ADP isomerization, which has previously been required to explain what happens to fiber mechanics when both Pi and MgADP build up (32). Indeed, we have found that the A.M.ADP isomerization, which we assigned as the strain-dependent step, is required to give a closer match between the simulated P∼NDPK-IDCC dephosphorylation and that determined from the observed ΔFl during the period of force redevelopment. This step is also rate limiting in the cross-bridge cycle during isometric contraction, and the rate constants of 3–6 s−1 are within the range of values (2–23 s−1) measured or modeled previously (7,11,25,32,33). The acceleration of the isomerization step (Table 2) was governed by parameter xk6, which is the maximum rate of A.M.ADP isomerization leading to MgADP release at zero tension; this parameter was free to vary in these models. In simulations where A.M.ADP isomerization was excluded, NDPK-IDCC formation during the period of force recovery was too fast to match the observed time course of P∼NDPK-IDCC dephosphorylation.
Based on the modeled time courses of MgADP production (Fig. 10), 27 μM of extra MgADP was produced during the period of force redevelopment at 12°C. Assuming a myosin head concentration of 150 μM, and assuming that the depopulation of force-bearing states during force recovery accounts for the incremental increase in MgADP, this observation predicts that 18% of the cross-bridges were in force-bearing A.M.ADP states before the length change. This matches the summed occupancy of the two ADP-containing states (A.M.ADP′ + A.M.ADP′), suggesting that product release from chiefly the A.M.ADP states could explain the extra MgADP released during force recovery at 12°C. At the low temperature, the simulations indicate that the preisomerization A.M.ADP′ state was the dominant ADP-containing state before quick release (Fig. 9). Depopulation of A.M.ADP′ upon quick release was followed by transient accumulation of the postisomerization A.M.ADP′ state during force recovery. Hence, the amplitude of the MgADP transient at 12°C could be largely explained by the reduction in A.M.ADP′, and the rate of MgADP sensitive P∼NDPK-IDCC dephosphorylation seemed to be explained by the isomerization to A.M.ADP′.
Temperature sensitivity in the kinetic scheme
A temperature change between 12 and 20°C affects various state transitions in the actomyosin cycle (Table 2), in particular, the hydrolysis of MgATP (Q10 > 5), phosphate release (Q10 > 4), the isomerization of A.M.ADP states (Q10 > 2), and the acceleration of MgADP release (see Table 2) during force recovery (Q10 > 7). The forward and reverse steps from ATP binding up to the point of Pi release were moderately temperature-sensitive (2 < Q10 < 3.5). The t1/2 for tension recovery after a quick release, determined from the average force records, was 20 ms at 12°C and 11 ms at 20°C, giving Q10 = 2.1 for the rate of tension recovery, which is similar to the value of 2.5 determined in a study of Pi release during force redevelopment (25).
The temperature sensitivity of the ATP-hydrolysis step is in agreement with previous experiments and simulations (5,6,25). The cross-bridge attachment and force generation steps (k3 and k4 in Fig. 6 and Table 2) are often modeled as a single fast transition (6,25,26,34) that is overall highly temperature-sensitive, in keeping with the endothermic nature of isometric force production. In the present scheme, the rates k3, r3, k4, and r4 highlight a relatively moderate temperature sensitivity, but overall the values and the temperature sensitivity were more in line with the “roll and lock” model of muscle force generation (5), which explains the temperature-dependent structural changes in actomyosin during force generation as a nonstereospecific (weakly bound) to stereospecific (strongly bound) transition in the A.M.ADP.Pi state. We included the isomerization from A.M.ADP.Pi to A.M.ADP.Pi′ in these simulations to extend our previous approaches, which lumped together the attachment and isomerization processes (15,25,26), although we have no direct data to constrain the rate constants or to impose any strain dependence on transitions between the states leading up to Pi release. Nevertheless, the kinetics of cross-bridge attachment and isomerization of attached Pi-occupied states are in general agreement with other models in the sense that the transitions are rapid and sandwiched between the step that is rate limiting for force generation (MgATP hydrolysis) and a relatively slow Pi release step (6,25,34–36).
The amplitude of the modeled MgADP transient was 63 μM at 20°C. The total occupancy of the strongly bound states (A.M.ADP.Pi′ + A.M.ADP′ + A.M.ADP′), which make up 36% of total A.M states, is close to the fraction of force-bearing cross-bridges predicted from the modeled MgADP transient (42%), indicating that redistribution of the total population of the strongly attached cross-bridges could explain product release at the higher temperature. The estimations of total strongly bound cross-bridges (36–42%) fall between previous estimates of 20–50% (5,37). The larger amplitude of the MgADP transient at 20°C could also reflect greater flux through the cross-bridge states because of cross-bridge cycling as the force recovery progressed at the higher temperature. It is important to note that although the model at 20°C predicts the amplitude of the [NDPK-IDCC] transient quite well, it fits rather poorly to the observed time course of force redevelopment (Fig. 8). This is also true at the beginning of the force time course (not shown). These discrepancies are less evident in the simulation of the 12°C observations (Figs. 7 and 8). Factors such as filament compliance, fiber-end compliance, the role of other strain-dependent steps in the kinetic scheme (e.g., the transition from weak to strong binding states), strain distribution among the attached cross-bridges, and perhaps fiber mechanical resonance may affect the simulation of the force time course at higher temperatures. Since the MgADP release and relative force are interrelated in the model, the rate of P∼NDPK-IDCC dephosphorylation could also be affected by these factors.
The simulations suggest that temperature-dependent redistribution of strongly bound force-bearing A.M states during isometric contraction can be chiefly explained by the temperature sensitivity of Pi release (Q10 = 4.1), A.M.ADP isomerization (Q10 = 2.1), and MgADP binding (Q10 = 2.2). At 12°C, the proportion of cross-bridges in the A.M.ADP.Pi′ state was greater than the sum of the two A.M.ADP states in the period just before the quick release. This was not the case at 20°C: the higher temperature resulted in 1), a shift to a relatively higher A.M.ADP′ occupancy, which slightly exceeded A.M.ADP.Pi′ occupancy just before quick release; and 2), a 30% reduction in the occupancy of the strongly bound A.M.ADP.Pi′ state. The shift toward lower occupancy of the strongly bound Pi-occupied states at higher temperature is consistent with our previous simulations of force and Pi release (25). More experimentation over a broader range of temperatures is needed to establish the significance of changes in, for example, the values generated for steady-state (prerelease) A.M.ADP′ occupancy (the models in Table 2 generate values for A.M.ADP′ occupancy that are 7% and 19% of total force-bearing states at 12°C and 20°C, respectively). We tried simulations using the 20°C model, in which we purposely constrained the steady-state A.M.ADP′ state to a lower occupancy (e.g., ≤12% of force-bearing states). These simulations fit the force time course poorly. However, those simulations that do fit the NDPK-IDCC time course well also tend to show that 1), the steady-state occupancy of A.M.ADP.Pi′ is similar to that generated in the 20°C model in Table 2 (30–35% of total force-bearing states); and 2), occupancy of the preisomerization A.M.ADP′ state is increased (50–60%) compared to the constrained low level of postisomerization A.M.ADP′. Hence, even with this added constraint, the modeling results generally support the idea that the redistribution of strongly bound A.M states partly explains the observation that the amplitude of the MgADP transient increases during force recovery at higher temperatures, whereas the amplitude of Pi transient decreases slightly at higher temperatures (25).
At physiological temperature, it may be that isometric force is represented by an even greater reduction of the strongly bound A.M.ADP.Pi′ occupancy in favor of the ADP states. Future applications of time-resolved measurements of P∼NDPK-IDCC dephosphorylation, together with simulations that reflect the distribution of strain in cross-bridges and the distribution of the rate constants that determine occupancies of attached cross-bridges (36), will be important for testing this prediction.
Acknowledgments
We thank J. Hunter for producing the NDPK, and G. Reid (MRC National Institute for Medical Research, London, UK) for producing the NPE-caged ATP. We are grateful to R. Woledge and N. Curtin for their advice on the kinetic model and their comments on the manuscript. This work was supported by the Medical Research Council, UK.
References
- 1.Siemankowski R.F., Wiseman M.O., White H.D. ADP dissociation from actomyosin subfragment 1 is sufficiently slow to limit the unloaded shortening velocity in vertebrate muscle. Proc. Natl. Acad. Sci. USA. 1985;82:658–662. doi: 10.1073/pnas.82.3.658. [DOI] [PMC free article] [PubMed] [Google Scholar]
- 2.Weiss S., Rossi R., Pellegrino M.A., Bottinelli R., Geeves M.A. Differing ADP release rates from myosin heavy chain isoforms define the shortening velocity of skeletal muscle fibers. J. Biol. Chem. 2001;276:45902–45908. doi: 10.1074/jbc.M107434200. [DOI] [PubMed] [Google Scholar]
- 3.Irving M., Lombardi V., Piazzesi G., Ferenczi M.A. Myosin head movements are synchronous with the elementary force-generating process in muscle. Nature. 1992;357:156–158. doi: 10.1038/357156a0. [DOI] [PubMed] [Google Scholar]
- 4.Lombardi V., Piazzesi G., Ferenczi M.A., Thirlwell H., Dobbie I. Elastic distortion of myosin heads and repriming of the working stroke in muscle. Nature. 1995;374:553–555. doi: 10.1038/374553a0. [DOI] [PubMed] [Google Scholar]
- 5.Ferenczi M.A., Bershitsky S.Y., Koubassova N., Siththanandan V., Helsby W.I. The “roll and lock” mechanism of force generation in muscle. Structure. 2005;13:131–141. doi: 10.1016/j.str.2004.11.007. [DOI] [PubMed] [Google Scholar]
- 6.Sleep J., Irving M., Burton K. The ATP hydrolysis and phosphate release steps control the time course of force development in rabbit skeletal muscle. J. Physiol. 2005;563:671–687. doi: 10.1113/jphysiol.2004.078873. [DOI] [PMC free article] [PubMed] [Google Scholar]
- 7.Nyitrai M., Geeves M.A. Adenosine diphosphate and strain sensitivity in myosin motors. Philos. Trans. R. Soc. Lond. B Biol. Sci. 2004;359:1867–1877. doi: 10.1098/rstb.2004.1560. [DOI] [PMC free article] [PubMed] [Google Scholar]
- 8.Nyitrai M., Rossi R., Adamek N., Pellegrino M.A., Bottinelli R. What limits the velocity of fast-skeletal muscle contraction in mammals? J. Mol. Biol. 2006;355:432–442. doi: 10.1016/j.jmb.2005.10.063. [DOI] [PubMed] [Google Scholar]
- 9.Glyn H., Sleep J. Dependence of adenosine triphosphatase activity of rabbit psoas muscle fibres and myofibrils on substrate concentration. J. Physiol. 1985;365:259–276. doi: 10.1113/jphysiol.1985.sp015770. [DOI] [PMC free article] [PubMed] [Google Scholar]
- 10.He Z.H., Chillingworth R.K., Brune M., Corrie J.E.T., Trentham D.R. ATPase kinetics on activation of rabbit and frog permeabilized isometric muscle fibres: a real time phosphate assay. J. Physiol. 1997;501:125–148. doi: 10.1111/j.1469-7793.1997.125bo.x. [DOI] [PMC free article] [PubMed] [Google Scholar]
- 11.Hilber K., Sun Y.B., Irving M. Effects of sarcomere length and temperature on the rate of ATP utilisation by rabbit psoas muscle fibres. J. Physiol. 2001;531:771–780. doi: 10.1111/j.1469-7793.2001.0771h.x. [DOI] [PMC free article] [PubMed] [Google Scholar]
- 12.Potma E.J., Stienen G.J., Barends J.P., Elzinga G. Myofibrillar ATPase activity and mechanical performance of skinned fibres from rabbit psoas muscle. J. Physiol. 1994;474:303–317. doi: 10.1113/jphysiol.1994.sp020023. [DOI] [PMC free article] [PubMed] [Google Scholar]
- 13.Stephenson D.G., Stewart A.W., Wilson G.J. Dissociation of force from myofibrillar MgATPase and stiffness at short sarcomere lengths in rat and toad skeletal muscle. J. Physiol. 1989;410:351–366. doi: 10.1113/jphysiol.1989.sp017537. [DOI] [PMC free article] [PubMed] [Google Scholar]
- 14.Sun Y.B., Hilber K., Irving M. Effect of active shortening on the rate of ATP utilisation by rabbit psoas muscle fibres. J. Physiol. 2001;531:781–791. doi: 10.1111/j.1469-7793.2001.0781h.x. [DOI] [PMC free article] [PubMed] [Google Scholar]
- 15.West T.G., Curtin N.A., Ferenczi M.A., He Z.H., Sun Y.B. Actomyosin energy turnover declines while force remains constant during isometric muscle contraction. J. Physiol. 2004;555:27–43. doi: 10.1113/jphysiol.2003.040089. [DOI] [PMC free article] [PubMed] [Google Scholar]
- 16.Brune M., Corrie J.E.T., Webb M.R. A fluorescent sensor of the phosphorylation state of nucleoside diphosphate kinase and its use to monitor nucleoside diphosphate concentrations in real time. Biochemistry. 2001;40:5087–5094. doi: 10.1021/bi002484h. [DOI] [PubMed] [Google Scholar]
- 17.Huxley A.F. Muscle structure and theories of contraction. Prog. Biophys. Biophys. Chem. 1957;7:255–318. [PubMed] [Google Scholar]
- 18.He Z., Stienen G.J., Barends J.P., Ferenczi M.A. Rate of phosphate release after photoliberation of adenosine 5′-triphosphate in slow and fast skeletal muscle fibers. Biophys. J. 1998;75:2389–2401. doi: 10.1016/s0006-3495(98)77683-0. [DOI] [PMC free article] [PubMed] [Google Scholar]
- 19.Thirlwell H., Corrie J.E.T., Reid G.P., Trentham D.R., Ferenczi M.A. Kinetics of relaxation from rigor of permeabilized fast-twitch skeletal fibers from the rabbit using a novel caged ATP and apyrase. Biophys. J. 1994;67:2436–2447. doi: 10.1016/S0006-3495(94)80730-1. [DOI] [PMC free article] [PubMed] [Google Scholar]
- 20.Bershitsky S., Tsaturyan A., Bershitskaya O., Mashanov G., Brown P. Mechanical and structural properties underlying contraction of skeletal muscle fibers after partial 1-ethyl-3-[3-dimethylamino)propyl]carbodiimide cross-linking. Biophys. J. 1996;71:1462–1474. doi: 10.1016/S0006-3495(96)79347-5. [DOI] [PMC free article] [PubMed] [Google Scholar]
- 21.He Z.H., Bottinelli R., Pellegrino M.A., Ferenczi M.A., Reggiani C. ATP consumption and efficiency of human single muscle fibers with different myosin isoform composition. Biophys. J. 2000;79:945–961. doi: 10.1016/S0006-3495(00)76349-1. [DOI] [PMC free article] [PubMed] [Google Scholar]
- 22.He Z.H., Chillingworth R.K., Brune M., Corrie J.E.T., Webb M.R. The efficiency of contraction in rabbit skeletal muscle fibres, determined from the rate of release of inorganic phosphate. J. Physiol. 1999;517:839–854. doi: 10.1111/j.1469-7793.1999.0839s.x. [DOI] [PMC free article] [PubMed] [Google Scholar]
- 23.Barabas K., Keszthelyi L. Temperature dependence of ATP release from “caged” ATP. Acta Biochim. Biophys. Acad. Sci. Hung. 1984;19:305–309. [PubMed] [Google Scholar]
- 24.Khromov A.S., Somlyo A.P., Somlyo A.V. Photolytic release of MgADP reduces rigor force in smooth muscle. Biophys. J. 2001;80:1905–1914. doi: 10.1016/S0006-3495(01)76160-7. [DOI] [PMC free article] [PubMed] [Google Scholar]
- 25.Siththanandan V.B., Donnelly J.L., Ferenczi M.A. Effect of strain on actomyosin kinetics in isometric muscle fibers. Biophys. J. 2006;90:3653–3665. doi: 10.1529/biophysj.105.072413. [DOI] [PMC free article] [PubMed] [Google Scholar]
- 26.West T.G., Ferenczi M.A., Woledge R.C., Curtin N.A. Influence of ionic strength on the time course of force development and phosphate release by dogfish muscle fibres. J. Physiol. 2005;567:989–1000. doi: 10.1113/jphysiol.2005.087106. [DOI] [PMC free article] [PubMed] [Google Scholar]
- 27.Hancock C.R., Janssen E., Terjung R.L. Skeletal muscle contractile performance and ADP accumulation in adenylate kinase-deficient mice. Am. J. Physiol. 2005;288:C1287–C1297. doi: 10.1152/ajpcell.00567.2004. [DOI] [PubMed] [Google Scholar]
- 28.Cieslar J.H., Dobson G.P. Free [ADP] and aerobic muscle work follow at least second order kinetics in rat gastrocnemius in vivo. J. Biol. Chem. 2000;275:6129–6134. doi: 10.1074/jbc.275.9.6129. [DOI] [PubMed] [Google Scholar]
- 29.Coupland M.E., Puchert E., Ranatunga K.W. Temperature dependence of active tension in mammalian (rabbit psoas) muscle fibres: effect of inorganic phosphate. J. Physiol. 2001;536:879–891. doi: 10.1111/j.1469-7793.2001.00879.x. [DOI] [PMC free article] [PubMed] [Google Scholar]
- 30.Pate E., Franks-Skiba K., Cooke R. Depletion of phosphate in active muscle fibers probes actomyosin states within the powerstroke. Biophys. J. 1998;74:369–380. doi: 10.1016/S0006-3495(98)77794-X. [DOI] [PMC free article] [PubMed] [Google Scholar]
- 31.Brune M., Hunter J.L., Howell S.A., Martin S.R., Hazlett T.L. Mechanism of inorganic phosphate interaction with phosphate binding protein from Escherichia coli. Biochemistry. 1998;37:10370–10380. doi: 10.1021/bi9804277. [DOI] [PubMed] [Google Scholar]
- 32.Sleep J.A., Hutton R.L. Exchange between inorganic phosphate and adenosine 5′-triphosphate in the medium by actomyosin subfragment 1. Biochemistry. 1980;19:1276–1283. doi: 10.1021/bi00548a002. [DOI] [PubMed] [Google Scholar]
- 33.Geeves M.A. The dynamics of actin and myosin association and the crossbridge model of muscle contraction. Biochem. J. 1991;274:1–14. doi: 10.1042/bj2740001. [DOI] [PMC free article] [PubMed] [Google Scholar]
- 34.Coupland M.E., Pinniger G.J., Ranatunga K.W. Endothermic force generation, temperature-jump experiments and effects of increased [MgADP] in rabbit psoas muscle fibres. J. Physiol. 2005;567:471–492. doi: 10.1113/jphysiol.2005.090084. [DOI] [PMC free article] [PubMed] [Google Scholar]
- 35.Smith D.A., Sleep J. Mechanokinetics of rapid tension recovery in muscle: the myosin working stroke is followed by a slower release of phosphate. Biophys. J. 2004;87:442–456. doi: 10.1529/biophysj.103.037788. [DOI] [PMC free article] [PubMed] [Google Scholar]
- 36.Burton K., White H., Sleep J. Kinetics of muscle contraction and actomyosin NTP hydrolysis from rabbit using a series of metal-nucleotide substrates. J. Physiol. 2005;563:689–711. doi: 10.1113/jphysiol.2004.078907. [DOI] [PMC free article] [PubMed] [Google Scholar]
- 37.Cooke R., Crowder M.S., Thomas D.D. Orientation of spin labels attached to cross-bridges in contracting muscle fibres. Nature. 1982;300:776–778. doi: 10.1038/300776a0. [DOI] [PubMed] [Google Scholar]
- 38.Hill A.V. The heat of shortening and the dynamic constants of muscle. Proc. R. Soc. Lond. B. Biol. Sci. 1938;126:136–195. doi: 10.1098/rspb.1949.0019. [DOI] [PubMed] [Google Scholar]