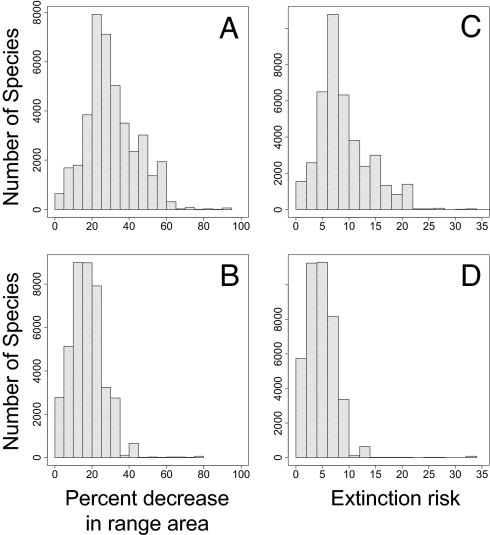
Fig. 3.
The percent reduction in species range areas under the modified BAU and GOV land-use change scenarios (A and B, respectively) and associated extinction risks (C and D, respectively). See Table S2 for habitat loss and extinction risk estimates per species.

