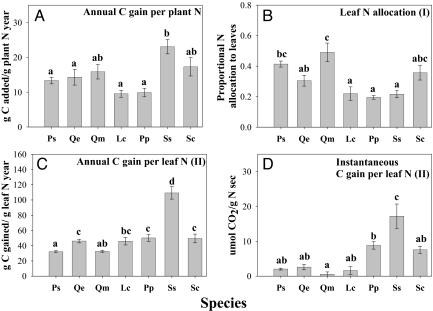
Fig. 3.
Mechanisms that drive annual carbon gained per unit plant nitrogen (A) (g C/g plant N yr): (B) proportional nitrogen allocation to leaves (I); (C) annual carbon gained per unit leaf nitrogen (II); (D) instantaneous carbon gained per unit leaf N at 1500 PAR (II; g C/g N sec). Species differences in plant and soil response variables were examined using one-way ANOVA; letters represent significant differences across species from post hoc Tukey tests (P < 0.05). For species abbreviations, see Fig. 2. Roman numerals refer to the framework in Fig. 1.

