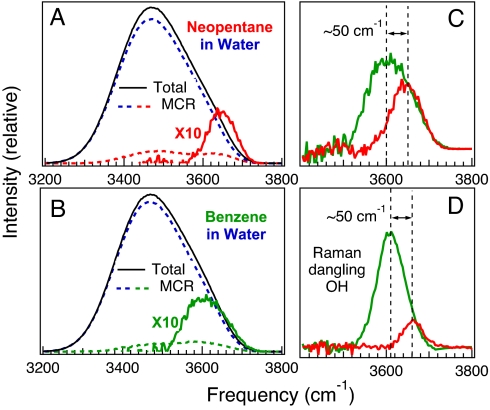
Fig. 3.
Comparison of simulated and experimental dangling OH vibrational bands. (A and B) Computer simulations of the electric field strengths experienced by water OH groups in aqueous neopentane (CH3)4C (A), and benzene C6H6 (B), solutions are used to predict the corresponding OH vibrational band shapes (solid black curves). The dashed curves in A and B show the corresponding bulk water (blue) and solute-correlated (red or green) MCR components obtained at a solute concentration of 0.77 M. (C and D) The resulting dangling OH features (C) around neopentane (red) and benzene (green) are compared with the corresponding experimental (D) dangling OH bands in neopentanol (red) and benzyl alcohol C6H5CH2OH (green), as further described in Results and Materials and Methods.

