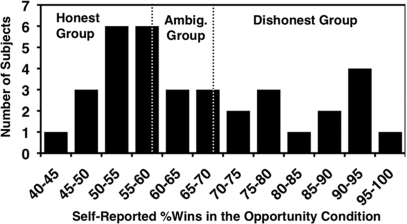
Fig. 2.
Distribution of self-reported percent Wins in the Opportunity condition. Subjects were classified into 3 groups based on the probability that they behaved dishonestly. Mean percent Wins in the No Opportunity condition was 50%. See Table 1 for reaction time data.

