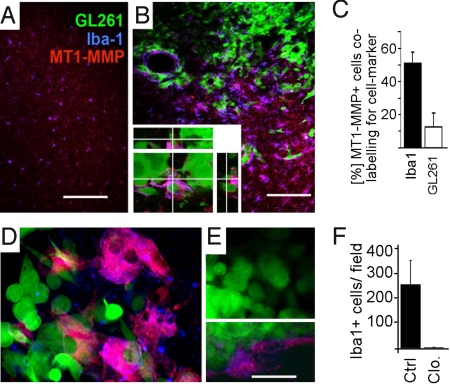
Fig. 1.
Iba1-positive cells are overexpressing MT1-MMP when associated with experimental gliomas. Mouse brains injected with GL261 glioma cells expressing EGFP (green) were studied for the microglia marker Iba1 (blue) and for the metalloprotease MT1-MMP (red). (A) In the control (i.e., non-injected) hemisphere, the level of MT1-MMP expression is low. (B) The density of microglial cells is much higher in the vicinity of gliomas than in normal brain. MT1-MMP is expressed in microglia associated with glioma. Labeling for MT1-MMP is especially intense in microglia making close contact with glioma cells, whereas GL261 glioma cells express only very low levels of MT1-MMP. A magnified 3D reconstructed micrograph of the tumor area is shown (Inset). (C) Quantification of MT1-MMP expression in microglia and glioma. (D) GFP-expressing glioma cells 5 d after injection into cultivated brain slices shows again that MT1-MMP (blue) is expressed on microglia and endothelia (labeled by isolectin-B4; red). (E) A microglia-depleted brain slice preparation 5 d after injection of GFP-expressing glioma cells was labeled as in D; note that there is no labeling for microglia, whereas labeling for endothelial cells is still present (Inset, E). (F) Quantification of labeling for Iba1 in cultivated brain slices treated with clodronate (Clo.; for microglia depletion) compared with control slices (Ctrl.; i.e., microglia are intact). (Scale bars: 150 μm in A and B, 75 μm and 35 μm in D and E.)

