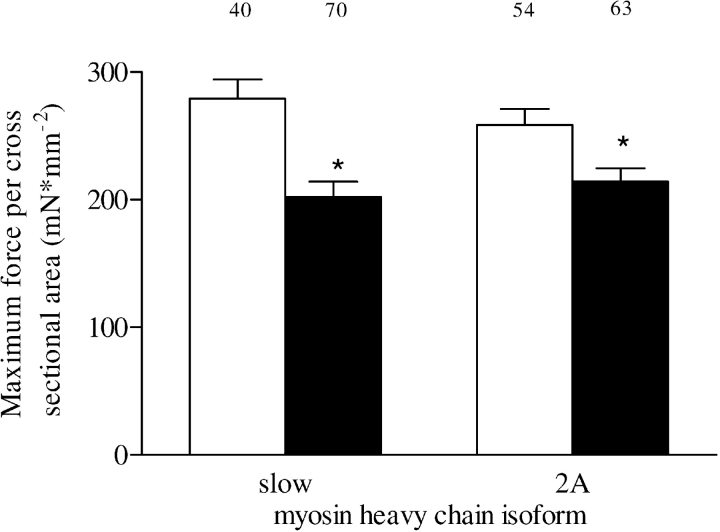
Figure 1.
Single-fiber maximum force per cross-sectional area in type slow and 2A fibers from patients with (solid bars) and without (white bars) chronic obstructive pulmonary disease (COPD). The numbers above the bars represent the total number of single fibers analyzed. Data are presented as model estimates ± SEM. *p < 0.05 difference from group without COPD.

