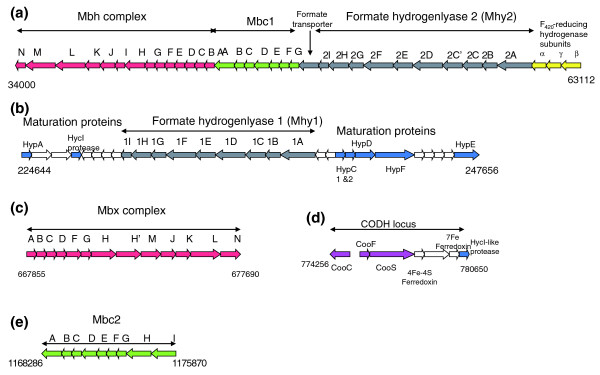
Figure 6.
Schematic representation of the loci encoding five membrane-bound complexes. Genes are indicated by arrows. Coordinates are in nucleotides. The genes are colored according to their structural homology (formate hydrogenlyase 1 and 2 in grey; Mbh/Mbx in red, Mbc1 and Mbc2 in green, CODH in purple, maturation proteins in blue). Exclusive T. gammatolerans genes are not colored.

