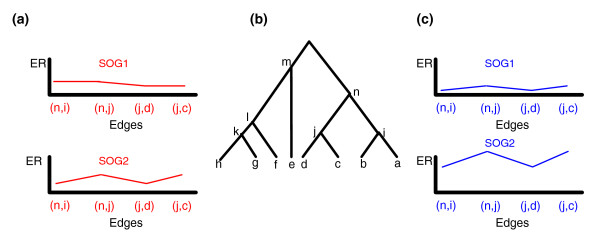
Figure 6.
Two hypothetical examples that demonstrate the difference between measuring co-evolution using rERP and applying the average ER along the entire evolutionary tree. (a) An example in which ER is high but rERP is low: two SOGs (in red) have similar average ER (|E1 - E2| is small) but the correlation between their ERP vectors is low. Note that the level of co-evolution is low in both cases, but the pattern along the phylogenetic tree is very different. (b) A hypothetical evolutionary tree. (c) An example in which ER is low but rERP is high: two SOGs (in blue) have similar ERPs but their mean ERs are different. In this case a similar pattern can be seen despite very different levels of ER.

