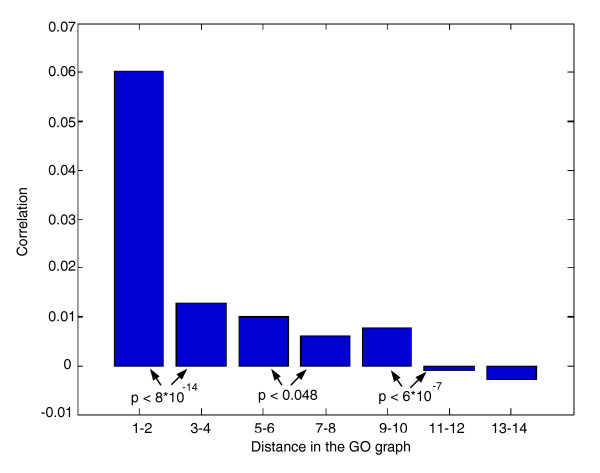
Figure 7.
Average correlation between the evolutionary patterns of pairs of GO groups (y-axis) as a function of their distance (the shortest connecting pathway) in the GO network (x-axis). The distribution of correlations in three out of six consecutive pairs of distance bins is significantly different (t-test, P < 0.05). The correlation between distance (x-axis) and average correlation (y-axis) is -0.96 (P < 4.5 × 10⁻⁴; a similar result was observed when we used the ontology of S. pombe (Additional data file 4)). The increase distance 9-10 though deviating from the overall trend is not significant (P = 0.23).

