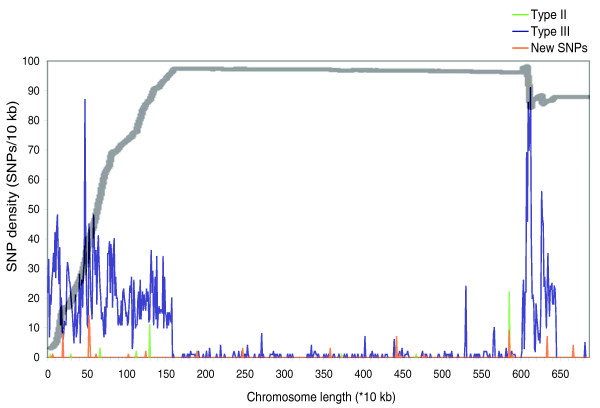
Figure 2.
Matching of type I SNP dominance and regions with a low SNP density in TgCkUg2. Comparison of SNP patterns in TgCkUg2 with those in the three sequenced reference genomes, GT1 (I), Me49 (II) and VEG (III) on chromosome XII. The underlying graph depicts the SNPs in TgCkUg2 relative to the type II and III reference strains (green and blue, respectively) as well as those unique to TgCkUg2 (orange). In TgCkUg2, chromosome XII was derived from the type III parent (as shown by a predominance of TgCkUg2 SNPs that matched the reference type III at that position), but had large regions with a very low SNP content. To correlate these regions of high and low polymorphism content with existing polymorphism data, all type I, II and III SNPs derived from the reference genome sequences were obtained. For each identified SNP, a running sum was computed across the chromosome as follows: +0 for a type I SNP, +1 for a type II SNP, and -1 for a type III SNP. This running sum was then plotted against the position in the genome of that SNP, creating the grey line shown. This shows that for the first 1.5 Mb of chromosome XII, type II SNPs predominate in the reference strains (types I, II and III, as indicated by the rising line), but at these positions TgCkUg2 has the type III allele (as indicated by the blue line). From approximately 1.5 Mb to 6 Mb, the chromosome is dominated by type I SNPs in the reference strains (as indicated by the straight grey line) and correspondingly there are very few polymorphisms between TgCkUg2 and the reference strains (similar maps for all 14 chromosomes can be found in Additional data file 2).

