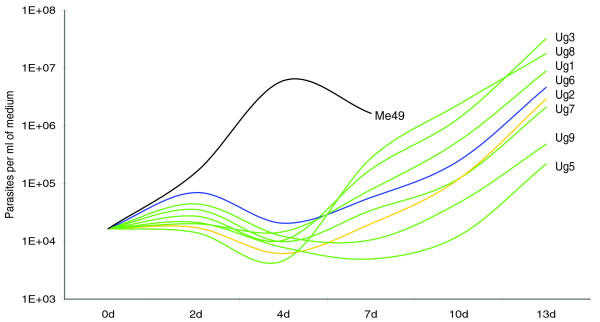
Figure 5.
Number of extracellular parasites per milliliter of medium during growth in cell culture. Q-PCR quantification of free parasites in cell culture (number of T. gondii/ml medium) at five different time points (0 to 13 days after inoculation) revealed an extended lag phase in all the Ugandan isolates compared with Me49. TgCkUg6 (blue) and TgCkUg2 (orange) had intermediate growth rates, and the fastest growing Ugandan strains were TgCkUg1, 3 and 8, while TgCkUg5 and 9 were extremely slow growing and never reached high numbers of free parasites. The difference between the Ugandan isolates and Me49 is probably due to their recent introduction in cell culture, but the difference between the Ugandan type II strains may have a genetic component. Interestingly, TgCkUg5 and 9 were the strains with the lowest frequency of local allelic variants.

