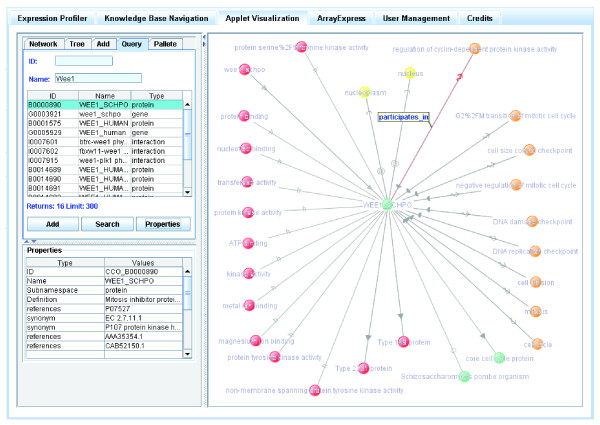
Figure 5.
CCO visualization applet. The CCO terms are shown as clickable, color-coded nodes, and mouse actions of the user are translated into pre-defined SPARQL queries that operate on the RDF representation of CCO. The results are returned as an XML file, which is translated into new nodes and edges that are then shown in the display. This visualization sample shows the local neighborhood of the protein WEE1_SCHPO ('Mitosis inhibitor protein kinase wee1').

