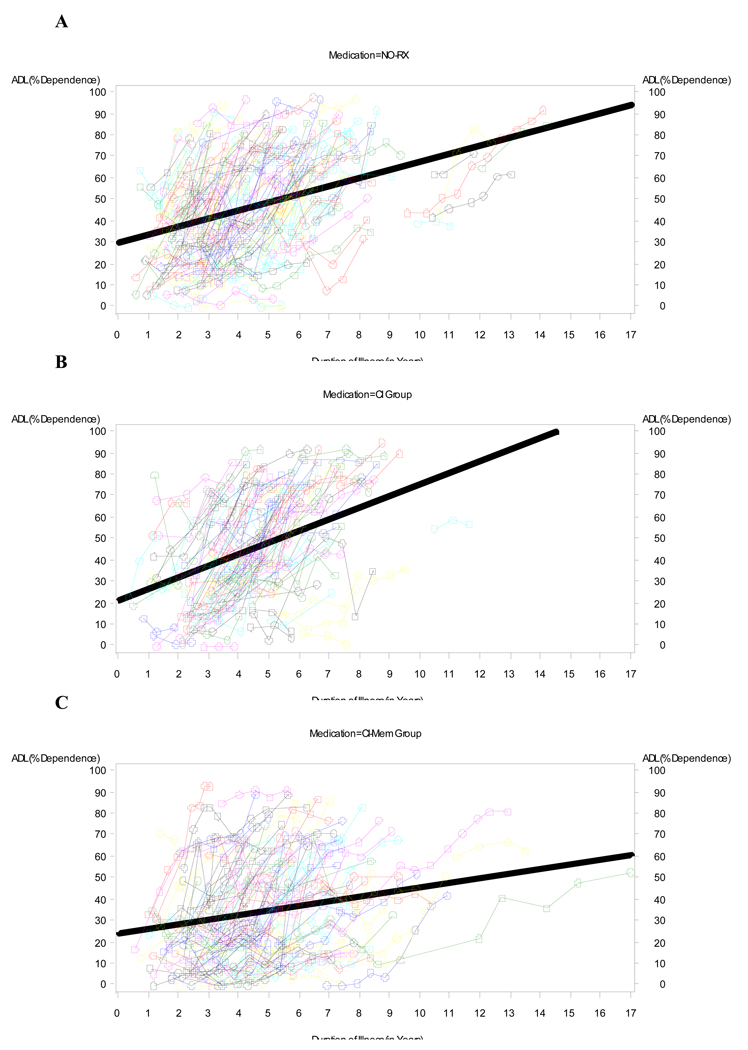
Fig 2.
Raw data for ADL versus Duration of Illness (symptoms) for A) NO-RX group (no medications), B) CI group, and C) COMBO group of subjects. Thin lines connect data for an individual (subject), while the thick line is the best fitting OLS regression line for the data. There is shallowing of the slope for the OLS regression lines going from NO-RX and CI to COMBO that is consistent with a slower rate of functional decline in the COMBO group.

