
Fig. 3.
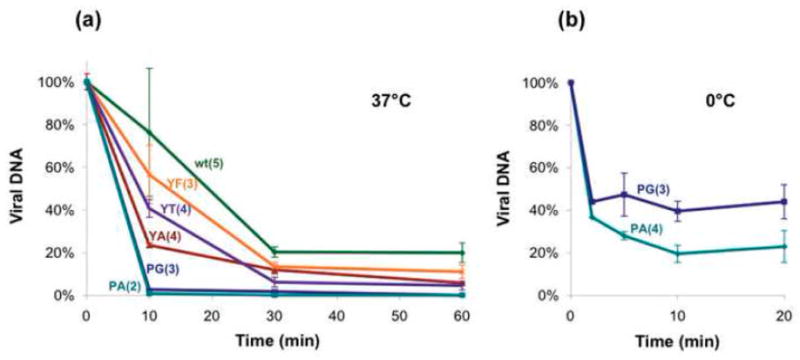
Stability analysis of the virions. Stability of mutants was measured as sensitivity to DNase I at 37°C (a) and at 0°C (b). Viral DNA amount was measured by RQ-PCR with primers covering the SV40 Poly A region. Results are presented as percentage of DNA at t=x relative to the DNA amount at the start point and are averages of several experimental repeats, as indicates in parentheses.