
Figure 3.
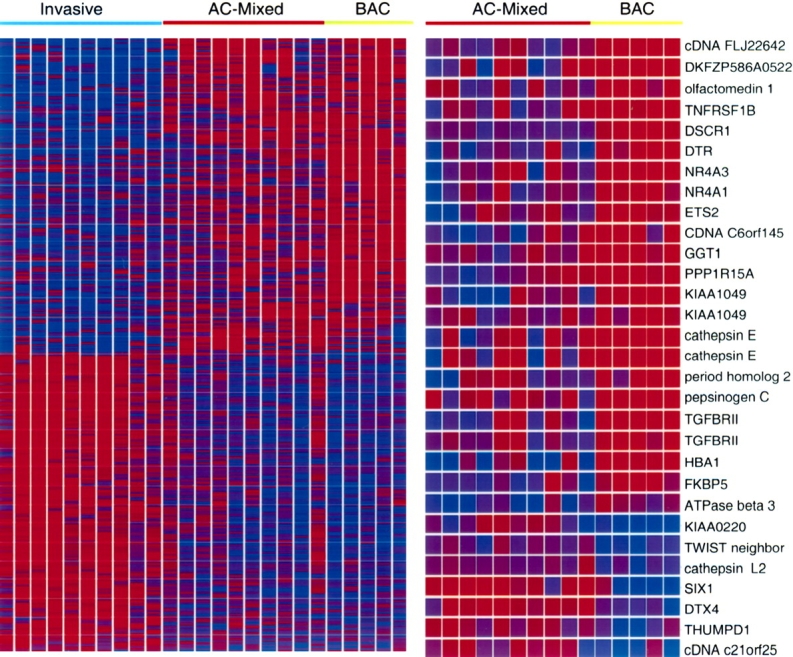
Supervised clustering of differentially expressed genes for the three subclasses of adenocarcinoma. Genes differentially expressed in three histologic subtypes (left panel) and in BAC versus AC-mixed (right panel) were identified using BRB-array tools, with p < 0.01. To determine that the class assignments were robust and that multiple testing was implicitly taken into account, class labels were randomly permuted 1,000 times and a permutation p value less than 0.01 was associated with each gene in the lists. The probability of obtaining at least 319 genes (left) and 30 genes (right) significant by chance (at the 0.01 level), if there were no real differences between the classes, was 0 and 0.002, respectively. Genes are on the y axis and tumors on the x axis. Red indicates high expression and blue indicates low expression, with the color scale at 0 to 5 relative to the experiment median.