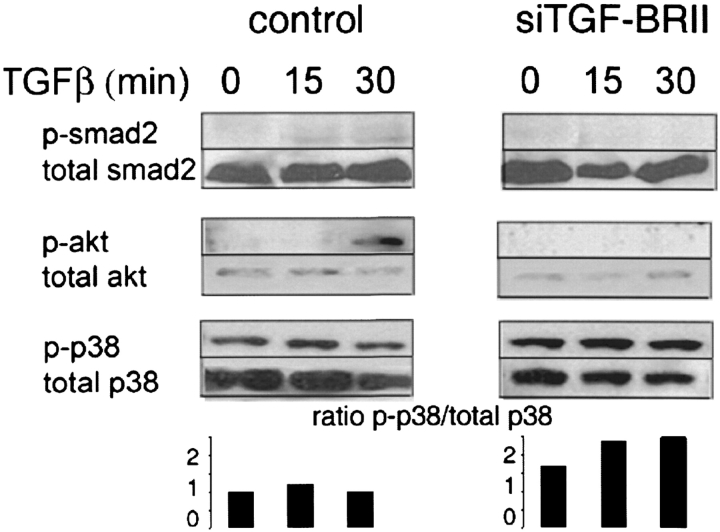
Figure 6.
Western analysis of TGF-β signaling pathway activation. H23 cell cultures transfected with control (left) or siRNA (right) constructs were incubated with TGF-β for the indicated times. Protein extracts were subjected to Western blot analysis with the indicated antibodies. The ratio of the intensity (densitometric units) of activated p38 relative to total p38 is indicated in the bottom panel.

