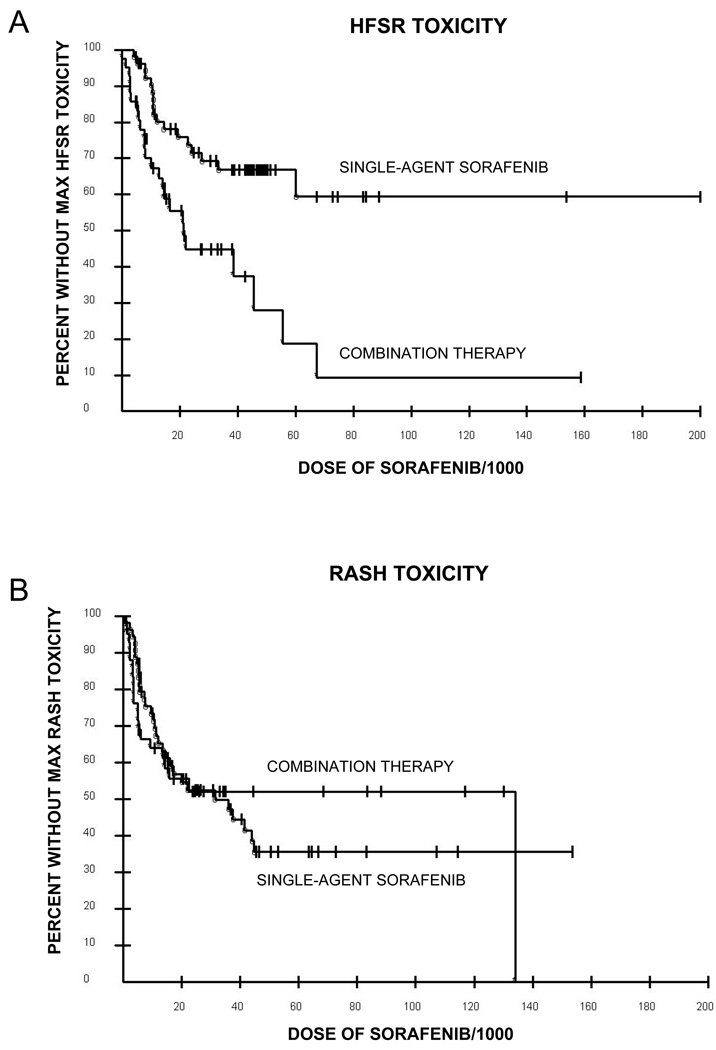
Figure 2.
A) Kaplan-Meier curves for the development of HFSR toxicity with single agent sorafenib (°) versus combination therapy (*), p=0.0008. Median dose of sorafenib to noted HFSR toxicity for combination therapy was 21,117 mg versus not reached for single agent. B) Kaplan-Meier curves for the development of rash with single agent sorafenib (°) versus combination therapy (*), p=0.99. Median dose of sorafenib to noted rash for combination therapy was 26,870 mg versus 31000 mg for single agent.

