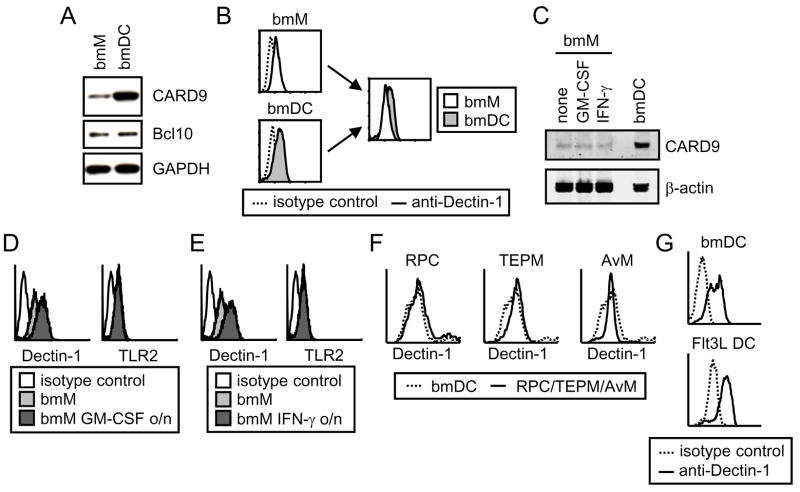
Figure 6. There is no correlation between Dectin-1, CARD9 and Bcl10 expression levels and the ability of Dectin-1 to directly induce TNF-α.
(A) CARD9 and Bcl10 levels in bmM and bmDC were compared by Western blotting, with GAPDH as a loading control. (B) Surface expression of Dectin-1 on bmM and bmDC was assessed by flow cytometry. (C) CARD9 expression by bmM and bmM pre-treated overnight with 10 ng/ml GM-CSF or 25 U/ml IFN-γ was assessed by Western blotting, with β-actin as a loading control. (D and E) Surface expression of Dectin-1 and TLR2 on bmM and bmM pre-treated overnight with 10 ng/ml GM-CSF (D) or 25 U/ml IFN-γ (E) was assessed by flow cytometry. (F and G) Dectin-1 surface expression by RPC, TEPM, AvM, bmDC and Flt3L DC was assessed by flow cytometry.

