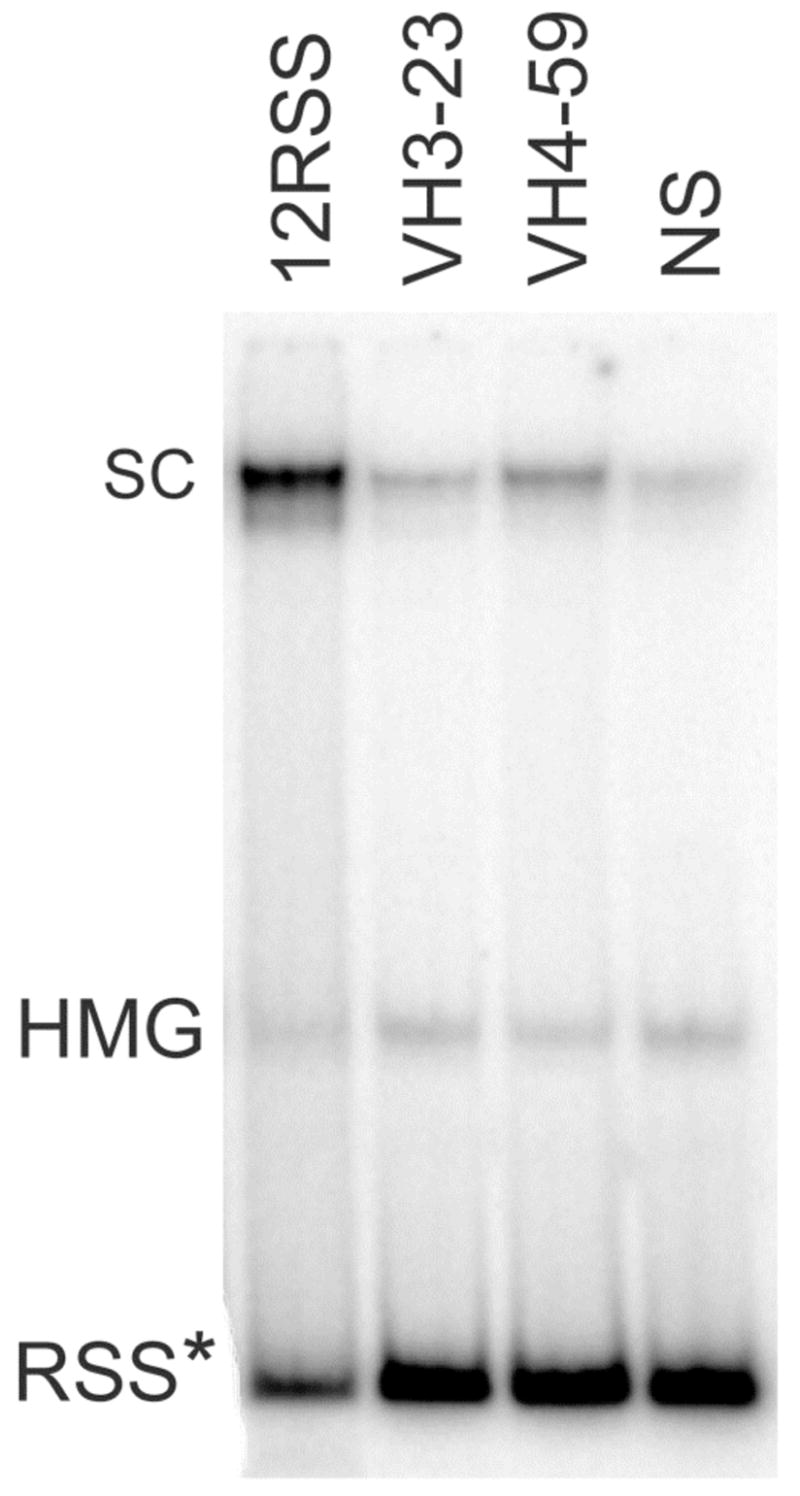
Figure 2. Electrophoretic Mobility Shift Assay of core RAG proteins binding to radiolabeled standard (12RSS), cRSS (from VH3-23 and VH4-59) and non-specific (NS) DNA substrates.

Stable RAG-DNA single complexes (SC) migrated more slowly than DNA-HMGB1 (HMG) complexes and free DNA (RSS). The results shown are from one of 3 different binding assays from which the DNA in a single complex was quantified. The mean and standard error (SE) of the percentage of DNA found in a RAG complex was 5.7 ± 1.4 for NS DNA, 6.6 ± 1.4 for VH3-23, 10.3 ± 1.1 for VH4-59 and 40.5 ± 7.6 for 12RSS. Significant differences were found when comparing the SC involving IGHV4-59 (p=.03) versus NS DNA and IGHVH3-23 versus IGHV4-59 (p=.05). RSS* denotes the mobility of each radiolabeled unbound RSS.
