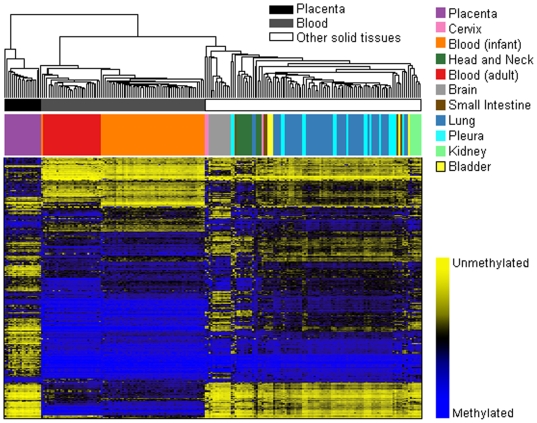
Figure 1. Unsupervised clustering of average beta values in normal human tissues.
Normal tissue sample average beta values were subjected to unsupervised hierarchical clustering based on Manhattan distance and average linkage. Each column represents a sample and each row represents a CpG locus (500 most variable autosomal loci). Above the heatmap, colors indicate tissue type as in key. In the heat map blue = average β of one, or methylated, and yellow = average β of zero, or unmethylated.

