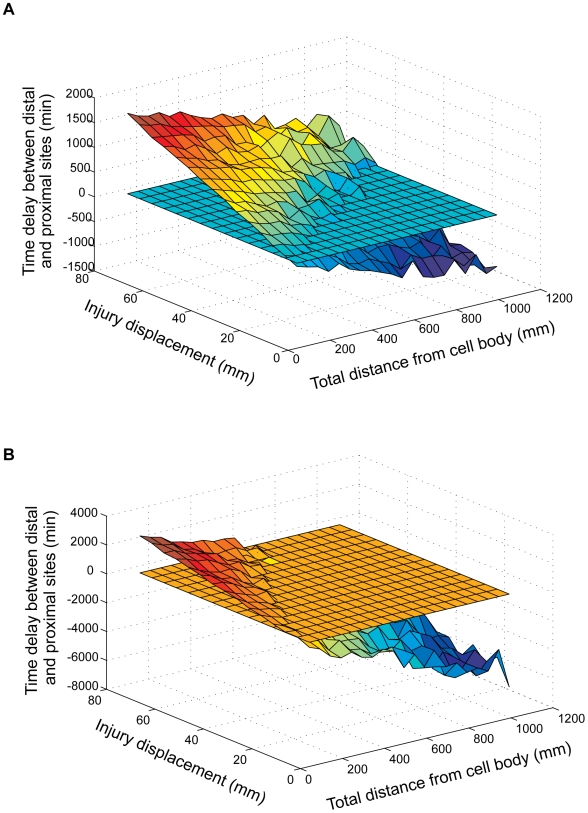
Figure 4. Best performance of the two signals versus two detectors models.
(A) Best performance of a two-signals model (detector sensitivity set at 10%) The horizontal plane represents a 60 minute cutoff, below which the time difference measured by the system is not likely to enable a differential biological response. (B) Best performance of a two-detectors model, obtained for a system configuration of two detectors with 5% sensitivity threshold and 80% sensitivity threshold. Performance graphs for additional sensitivity permutations of these two models are shown in Figures S3 and S4, respectively.

