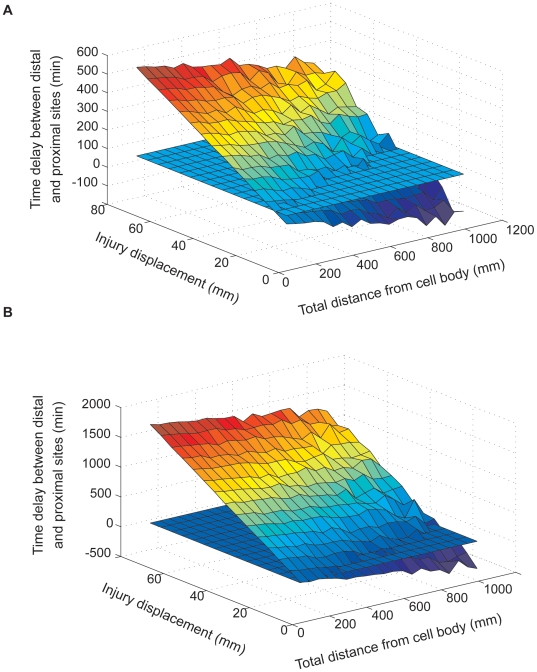
Figure 7. Comparing two dynein velocity data sets.
The figure depicts the results of executing a model with a 10% sensitivity threshold detector, based on the Schiavo lab dataset (A) and the Holzbaur lab dataset (B). Executions were performed for a model configuration that integrates 5 out of 10 slow signals.

