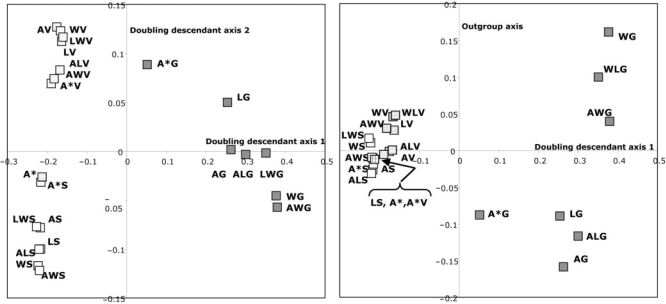
Fig. 5.
First three dimensions of principal coordinate analysis of distances among 22 inferences of ancestral genome, based on different configurations of outgroups. Left: dimensions 1 and 2. Right dimensions 1 and 3. Dimension labels assigned subjectively after the analysis. Genomes SC, CG, AG, KL and KW further abbreviated in displays to S, G, A (not to be confused with A for ancestor elsewhere in the text, nor with A*), L and W, respectively.

