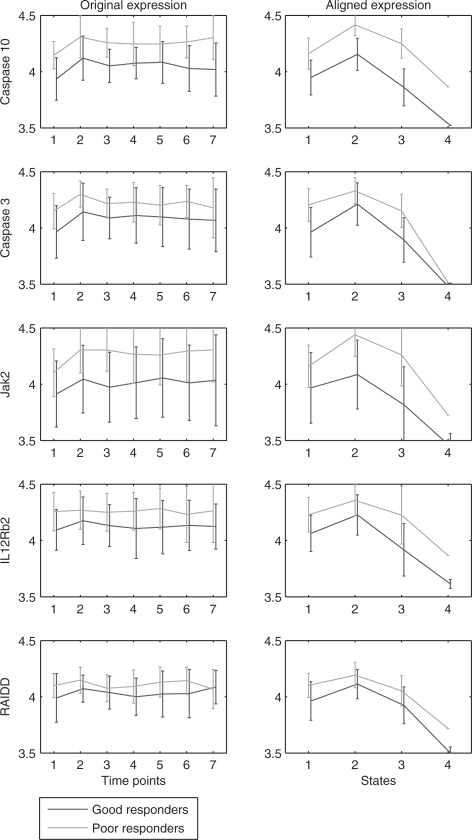
Fig. 5.
Mean and variance of expression profiles of unaligned and aligned genes selected for models using 5 or more time points. Plots in the same row are for the same gene. The right column presents, for each of the genes, the aligned expression profiles corresponding to the four states using the Viterbi algorithm. Alignment is based on the best discriminative HMM of all training–testing splits. In the learned model, the selected genes go up in the second state and back to initial level in the third state. The fourth state basically models outliers in the 6th and 7th time point, and hence transition probability into this state is small. The overlap between classes on the second and third states of all the five genes is smaller after the alignment leading to better discrimination between poor and good responders. This is critical for the correct identification of IL12Rb2 and RAIDD as two important features for later time points.

