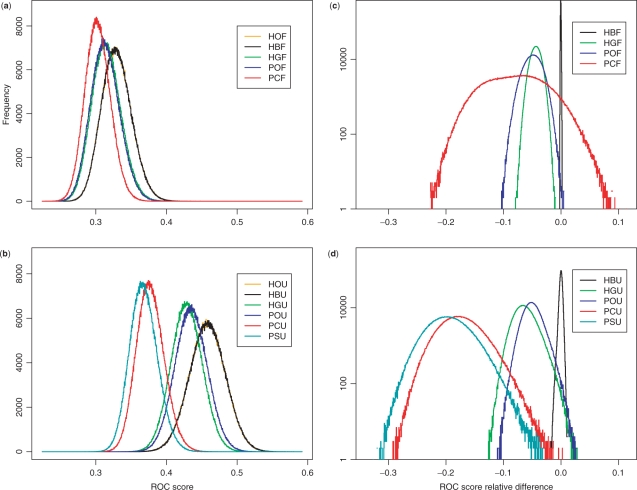
Fig. 2.
ROC score statistics of 1 million samples. In each sample, 224 superfamilies are first randomly chosen from 299 superfamilies. A representative query profile is then randomly selected from each chosen superfamily. ROC score histograms from using Pfam HMMs (a) and SUPERFAMILY HMMs (b) show appreciable difference in average ROC scores for each search method tested: SUPERFAMILY HMMs always perform better. Note that in panels (a) and (b), the curve for HO is completely covered by that for HB. Using HOF and HOU as baselines, the values of RRSD224 (measurement at 1 EPQ) between various methods and the baselines are computed for each sample. The resulting histograms are shown in panels (c) and (d).

