
Table 2.
Summary of statistics of RRSD224 between every pair search strategies using the same source
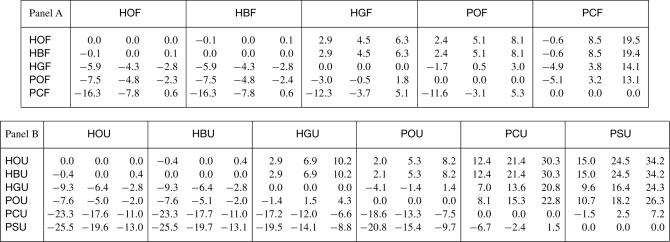 |
In Figure 2c and d, HOF and HOU were used as the baselines for Pfam and SUPERFAMILY search strategies, respectively, and the histograms of RRSD224 relative to the baselines are shown. It is impractical to show such histograms for all possible baselines. However, for each pair of search strategies, we may sort (in ascending order) their 1 million values of RRSD224 and record the corresponding RRSD224 value at various designated percentiles. In the table, there are three numbers in a row for any given pair of search strategies. As an example, the numbers 2.9, 4.5 and 6.3, associated with M1=HBF and M2=HGF, are located in the row labeled by HBF and within the column headed by HGF. Those numbers, when divided by 100, have the following interpretation: the leftmost corresponds to the RRSD224 value at the 2.5th percentile, the middle to the median and the rightmost to the 97.5th percentile. Panel A records the numbers associated with Pfam search methods, while Panel B documents those associated with the SUPERFAMILY strategies tested.