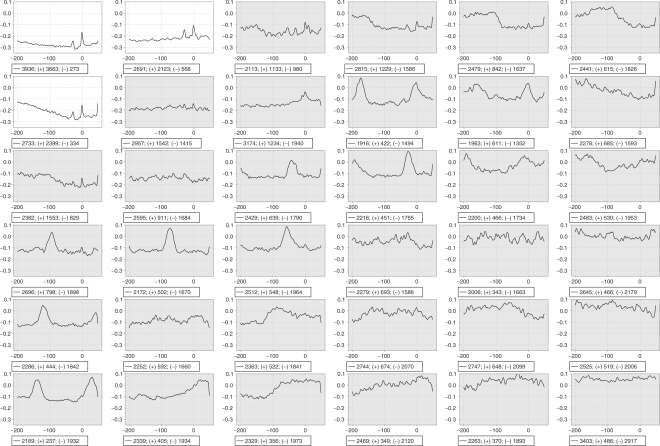
Fig. 4.
Result of SOM clustering on a 6 × 6 grid. The profile in each graph is the average of all sequences that map to that cluster. The sequences are converted using the base-stacking energy. The X-axis shows the position relative to the putative TSS. The two left-most clusters in the top row and the left-most cluster in the second row are promoter-rich and show the typical core promoter profile. The promoter-rich clusters are displayed with a white background, the others with a gray one. The legend shows the total number, the number of promoter (+) and the number of other (−) sequences.

