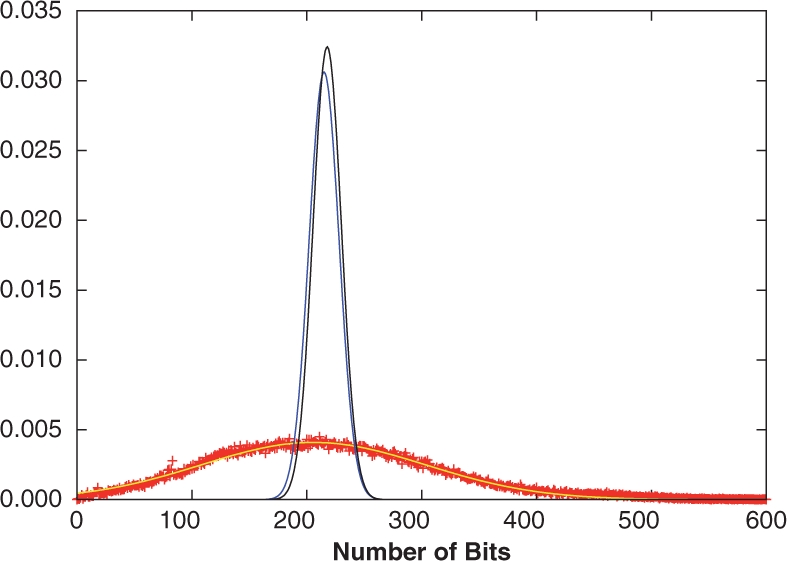
Fig. 1.

Distributions of 1-bits from the ChemDB fingerprints (red ‘+’), and the Binomial (blue) and multiple Bernoulli (black) fingerprint models. The empirical distribution was also fit to a Gaussian (yellow), which approximates the data well. While the model distribution means are close to the empirical mean, the distribution widths are significantly smaller.
